

Genetic association between intronic variants in AS3MT and arsenic methylation efficiency is focused on a large linkage disequilibrium cluster in chromosome 10
- PMID: 20014157
- PMCID: PMC2862143
- DOI: 10.1002/jat.1492
Genetic association between intronic variants in AS3MT and arsenic methylation efficiency is focused on a large linkage disequilibrium cluster in chromosome 10
Abstract
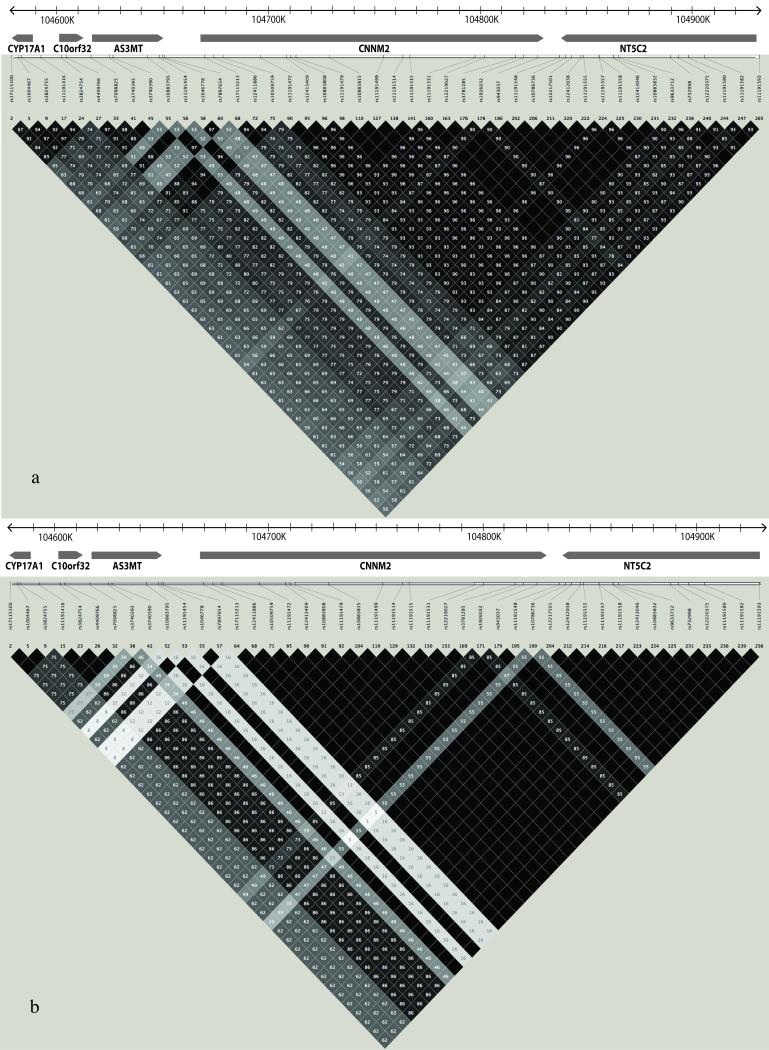
Differences in arsenic metabolism are known to play a role in individual variability in arsenic-induced disease susceptibility. Genetic variants in genes relevant to arsenic metabolism are considered to be partially responsible for the variation in arsenic metabolism. Specifically, variants in arsenic (3+ oxidation state) methyltransferase (AS3MT), the key gene in the metabolism of arsenic, have been associated with increased arsenic methylation efficiency. Of particular interest is the fact that different studies have reported that several of the AS3MT single nucleotide polymorphisms (SNPs) are in strong linkage-disequilibrium (LD), which also extends to a nearby gene, CYP17A1. In an effort to characterize the extent of the region in LD, we genotyped 46 SNPs in a 347,000 base region of chromosome 10 that included AS3MT in arsenic-exposed subjects from Mexico. Pairwise LD analysis showed strong LD for these polymorphisms, represented by a mean r(2) of 0.82, spanning a region that includes five genes. Genetic association analysis with arsenic metabolism confirmed the previously observed association between AS3MT variants, including this large cluster of linked polymorphisms, and arsenic methylation efficiency. The existence of a large genomic region sharing strong LD with polymorphisms associated with arsenic metabolism presents a predicament because the observed phenotype cannot be unequivocally assigned to a single SNP or even a single gene. The results reported here should be carefully considered for future genomic association studies involving AS3MT and arsenic metabolism.
Keywords: AS3MT; Arsenic; Linkage Disequilibrium; SNP; polymorphism.
(c) 2009 John Wiley & Sons, Ltd.
Figures


Similar articles
-
Arsenic metabolism is influenced by polymorphisms in genes involved in one-carbon metabolism and reduction reactions.Mutat Res. 2009 Jul 10;667(1-2):4-14. doi: 10.1016/j.mrfmmm.2008.07.003. Epub 2008 Jul 17. Mutat Res. 2009. PMID: 18682255
-
Efficient arsenic metabolism--the AS3MT haplotype is associated with DNA methylation and expression of multiple genes around AS3MT.PLoS One. 2013;8(1):e53732. doi: 10.1371/journal.pone.0053732. Epub 2013 Jan 14. PLoS One. 2013. PMID: 23341986 Free PMC article. Clinical Trial.
-
N-6-adenine-specific DNA methyltransferase 1 (N6AMT1) polymorphisms and arsenic methylation in Andean women.Environ Health Perspect. 2013 Jul;121(7):797-803. doi: 10.1289/ehp.1206003. Epub 2013 May 10. Environ Health Perspect. 2013. PMID: 23665909 Free PMC article.
-
[Relationship between Arsenic (+3 Oxidation State) Methyltransferase Genetic Polymorphisms and Methylation Capacity of Inorganic Arsenic].Nihon Eiseigaku Zasshi. 2015;70(3):186-96. doi: 10.1265/jjh.70.186. Nihon Eiseigaku Zasshi. 2015. PMID: 26411936 Review. Japanese.
-
Individual variations in inorganic arsenic metabolism associated with AS3MT genetic polymorphisms.Int J Mol Sci. 2011;12(4):2351-82. doi: 10.3390/ijms12042351. Epub 2011 Apr 4. Int J Mol Sci. 2011. PMID: 21731446 Free PMC article. Review.
Cited by
-
Heritability and preliminary genome-wide linkage analysis of arsenic metabolites in urine.Environ Health Perspect. 2013 Mar;121(3):345-51. doi: 10.1289/ehp.1205305. Epub 2013 Jan 15. Environ Health Perspect. 2013. PMID: 23322787 Free PMC article.
-
Common Polymorphisms at the CYP17A1 Locus Associate With Steroid Phenotype: Support for Blood Pressure Genome-Wide Association Study Signals at This Locus.Hypertension. 2016 Apr;67(4):724-732. doi: 10.1161/HYPERTENSIONAHA.115.06925. Epub 2016 Feb 22. Hypertension. 2016. PMID: 26902494 Free PMC article.
-
Nutrition, one-carbon metabolism and arsenic methylation.Toxicology. 2021 Jun 15;457:152803. doi: 10.1016/j.tox.2021.152803. Epub 2021 Apr 24. Toxicology. 2021. PMID: 33905762 Free PMC article. Review.
-
SLCO1B1 variants and urine arsenic metabolites in the Strong Heart Family Study.Toxicol Sci. 2013 Nov;136(1):19-25. doi: 10.1093/toxsci/kft181. Epub 2013 Aug 22. Toxicol Sci. 2013. PMID: 23970802 Free PMC article.
-
Linkage Analysis of Urine Arsenic Species Patterns in the Strong Heart Family Study.Toxicol Sci. 2015 Nov;148(1):89-100. doi: 10.1093/toxsci/kfv164. Epub 2015 Jul 23. Toxicol Sci. 2015. PMID: 26209557 Free PMC article.
References
-
- Barrett JC, Fry B, Maller J, Daly MJ. Haploview: analysis and visualization of LD and haplotype maps. Bioinformatics. 2005;21:263–265. - PubMed
-
- Chen YC, Guo YL, Su HJ, Hsueh YM, Smith TJ, Ryan LM, Lee MS, Chao SC, Lee JY, Christiani DC. Arsenic Methylation and Skin Cancer Risk in Southwestern Taiwan. J Occup Environ Med. 2003;45:241–248. - PubMed
-
- Chiou HY, Hsueh YM, Liaw KF, Horng SF, Chiang MH, Pu YS, Lin JS, Huang CH, Chen CJ. Incidence of internal cancers and ingested inorganic arsenic: a seven-year follow-up study in Taiwan. Cancer Res. 1995;55:1296–1300. - PubMed
-
- Concha G, Vogler G, Lezcano D, Nermell B, Vahter M. Exposure to inorganic arsenic metabolites during early human development. Toxicol Sci. 1998;44:185–190. - PubMed
Publication types
MeSH terms
Substances
Grants and funding
LinkOut - more resources
Full Text Sources
Medical
Research Materials
