

Kinetics of the UV-induced DNA damage response in relation to cell cycle phase. Correlation with DNA replication
- PMID: 20014310
- PMCID: PMC2880399
- DOI: 10.1002/cyto.a.20839
Kinetics of the UV-induced DNA damage response in relation to cell cycle phase. Correlation with DNA replication
Abstract
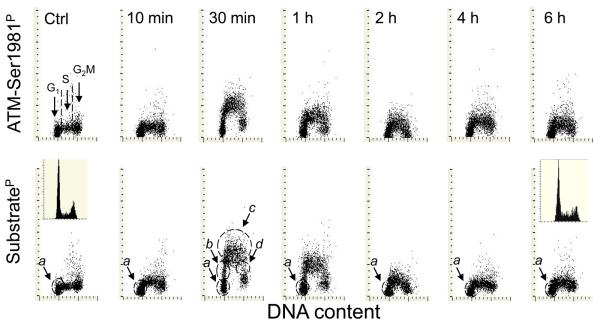
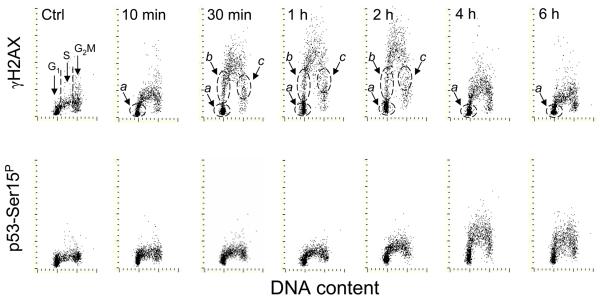
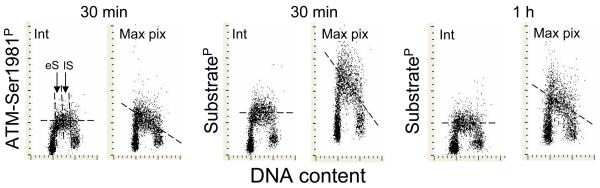
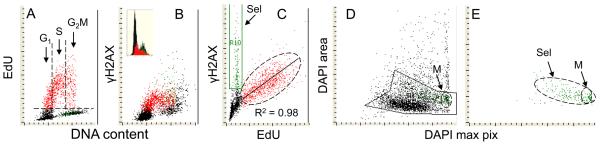
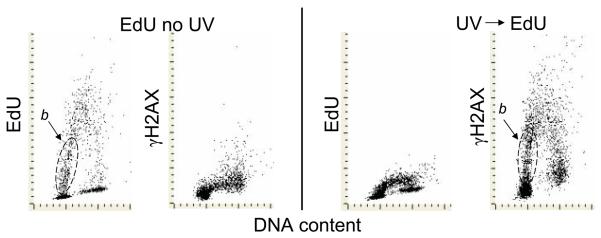
It has been reported that exposure to UV light triggers DNA damage response (DDR) seen as induction of gammaH2AX not only in S- but also in G(1)-phase cells. In the present study, in addition to gammaH2AX, we assessed other markers of DDR, namely phosphorylation of ATM on Ser1981, of ATM/ATR substrate on Ser/Thr at SQ/TQ cluster domains and of the tumor suppressor p53 on Ser15, in human pulmonary carcinoma A549 cells irradiated with 50 J/m(2) of UV-B. Phosphorylation of these proteins detected with phospho-specific Abs and measured by laser scanning cytometry in relation the cell cycle phase was found to be selective to S-phase cells. The kinetics of phosphorylation of ATM was strikingly similar to that of ATM/ATR substrate, peaking at 30 min after UV irradiation and followed by rapid dephosphorylation. The peak of H2AX phosphorylation was seen at 2 h and the peak of p53 phosphorylation at 4 h after exposure to UV light. Local high spatial density of these phospho-proteins reported by intensity of maximal pixel of immunofluorescence in the DDR nuclear foci was distinctly more pronounced in the early compared to late portion of S-phase. Exposure of cells to UV following 1 h pulse-labeling of their DNA with 5-ethynyl-2'deoxyuridine (EdU) made it possible to correlate the extent of DNA replication during the pulse with the extent of the UV-induced H2AX phosphorylation within the same cells. This correlation was very strong (R(2) = 0.98) and the cells that did not incorporate EdU showed no evidence of H2AX phosphorylation. The data are consistent with the mechanism in which stalling of DNA replication forks upon collision with the primary UV-induced DNA lesions and likely formation of double-strand DNA breaks triggers DDR. The prior reports (including our own) on induction of gammaH2AX in G(1) cells by UV may have erroneously identified cells initiating DNA replication following UV exposure as G(1) cells due to the fact that their DNA content did not significantly differ from that of G(1) cells that had not initiated DNA replication.
(c) 2009 International Society for Advancement of Cytometry.
Figures

Similar articles
-
DNA damage response induced by tobacco smoke in normal human bronchial epithelial and A549 pulmonary adenocarcinoma cells assessed by laser scanning cytometry.Cytometry A. 2009 Oct;75(10):840-7. doi: 10.1002/cyto.a.20778. Cytometry A. 2009. PMID: 19658174 Free PMC article.
-
Induction of DNA damage signaling by oxidative stress in relation to DNA replication as detected using "click chemistry".Cytometry A. 2011 Nov;79(11):897-902. doi: 10.1002/cyto.a.21137. Epub 2011 Sep 8. Cytometry A. 2011. PMID: 21905210 Free PMC article.
-
Effects of hydroxyurea and aphidicolin on phosphorylation of ataxia telangiectasia mutated on Ser 1981 and histone H2AX on Ser 139 in relation to cell cycle phase and induction of apoptosis.Cytometry A. 2006 Apr;69(4):212-21. doi: 10.1002/cyto.a.20241. Cytometry A. 2006. PMID: 16528719
-
Analysis of individual molecular events of DNA damage response by flow- and image-assisted cytometry.Methods Cell Biol. 2011;103:115-47. doi: 10.1016/B978-0-12-385493-3.00006-1. Methods Cell Biol. 2011. PMID: 21722802 Free PMC article. Review.
-
Cytometry of ATM activation and histone H2AX phosphorylation to estimate extent of DNA damage induced by exogenous agents.Cytometry A. 2007 Sep;71(9):648-61. doi: 10.1002/cyto.a.20426. Cytometry A. 2007. PMID: 17622968 Free PMC article. Review.
Cited by
-
γH2AX in the S Phase after UV Irradiation Corresponds to DNA Replication and Does Not Report on the Extent of DNA Damage.Mol Cell Biol. 2020 Sep 28;40(20):e00328-20. doi: 10.1128/MCB.00328-20. Print 2020 Sep 28. Mol Cell Biol. 2020. PMID: 32778572 Free PMC article.
-
Nutriomes and nutrient arrays - the key to personalised nutrition for DNA damage prevention and cancer growth control.Genome Integr. 2010 Aug 12;1(1):11. doi: 10.1186/2041-9414-1-11. Genome Integr. 2010. PMID: 20704708 Free PMC article.
-
Sulfur Mustard Analog Mechlorethamine (Bis(2-chloroethyl)methylamine) Modulates Cell Cycle Progression via the DNA Damage Response in Human Lung Epithelial A549 Cells.Chem Res Toxicol. 2019 Jun 17;32(6):1123-1133. doi: 10.1021/acs.chemrestox.8b00417. Epub 2019 Apr 22. Chem Res Toxicol. 2019. PMID: 30964658 Free PMC article.
-
Laser scanning cytometry: principles and applications-an update.Methods Mol Biol. 2013;931:187-212. doi: 10.1007/978-1-62703-056-4_11. Methods Mol Biol. 2013. PMID: 23027005 Free PMC article. Review.
-
Cell synchronization by inhibitors of DNA replication induces replication stress and DNA damage response: analysis by flow cytometry.Methods Mol Biol. 2011;761:85-96. doi: 10.1007/978-1-61779-182-6_6. Methods Mol Biol. 2011. PMID: 21755443 Free PMC article.
References
-
- Sinha RP, Häder D-P. UV-induced DNA damage and repair: a review. Photochem Photobiol Sci. 2002;1:225–236. - PubMed
-
- Sancar A, Lindsey-Bolz LA, Ŭnsal-Kaçmaz K, Linn S. Molecular mechanisms of mammalian DNA repair and the damage checkpoints. Annu Rev Biochem. 2004;73:39–85. - PubMed
-
- Lindahl T, Wood RD. Quality control by DNA repair. Science. 1999;286:1897–1905. - PubMed
-
- Goodsell DS. The molecular perspective: Ultraviolet light and pyrimidine dimers. The Oncologist. 2001;6:289–299. - PubMed
Publication types
MeSH terms
Substances
Grants and funding
LinkOut - more resources
Full Text Sources
Molecular Biology Databases
Research Materials
Miscellaneous
