

Iliac crest angle: a novel sonographic parameter for the prediction of Down syndrome risk during the second trimester of pregnancy
- PMID: 20014361
- PMCID: PMC2947378
- DOI: 10.1002/uog.7477
Iliac crest angle: a novel sonographic parameter for the prediction of Down syndrome risk during the second trimester of pregnancy
Abstract
Objectives: To validate a new sonographic technique for the display and measurement of fetal iliac crest angle (ICA), and to determine the relative contribution of standardized fetal pelvic measurements for estimating risk of Down syndrome during the second trimester of pregnancy.
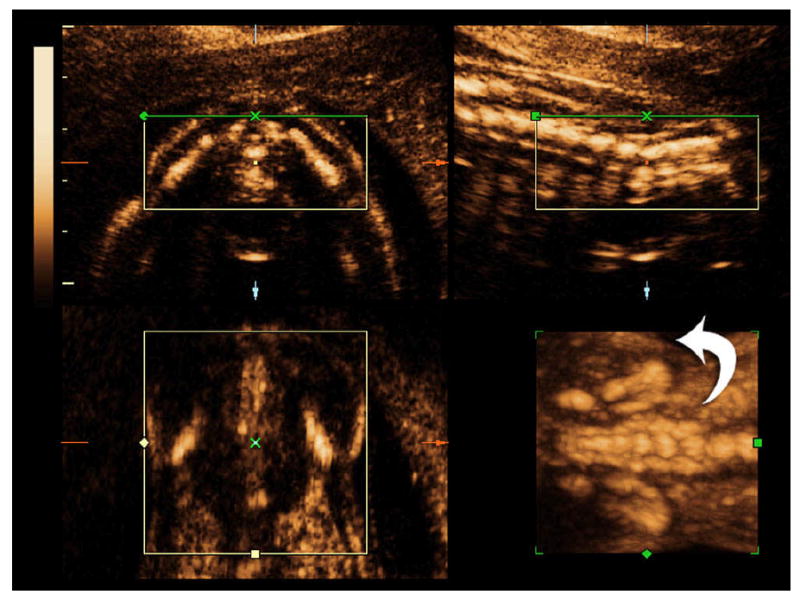
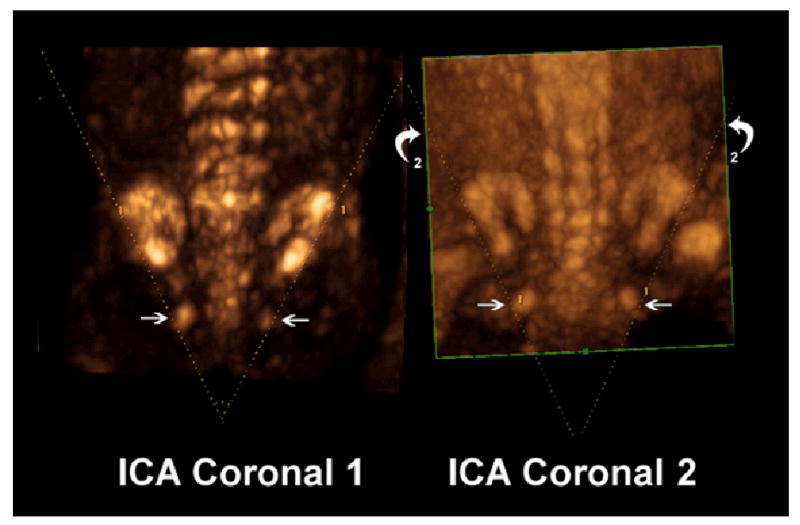
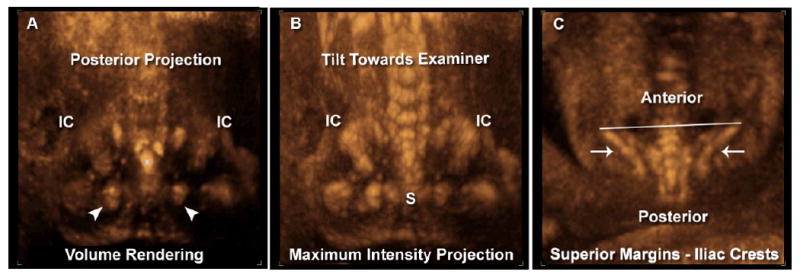
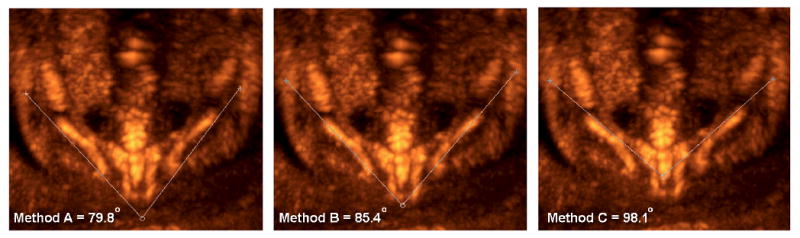
Methods: Three-dimensional ultrasonography of the fetal pelvis was performed during a second-trimester scan for genetic amniocentesis. A coronal view of the 'virtual pelvis' was obtained by applying a maximum intensity projection algorithm to visualize both iliac wings. Two different ICAs were measured from a coronal projection of the fetal pelvis (ICA-coronal 1 and ICA-coronal 2); the latter approach relied on using ischial tuberosities as reference landmarks. Next, a coronal projection of the fetal pelvis was rotated to demonstrate a rendered view of the axial fetal pelvis. Axial inner (ICA-inner), middle (ICA-middle) and outer (ICA-outer) ICAs were measured. The maximum anterior iliac distance measurement was defined as the widest separation between the most anterior points of the rendered iliac crests. The reproducibility of each ICA method was analyzed using Bland-Altman statistics. Simple and multiple logistic regression analysis determined the relative contribution of each parameter as a prenatal predictor of Down syndrome.
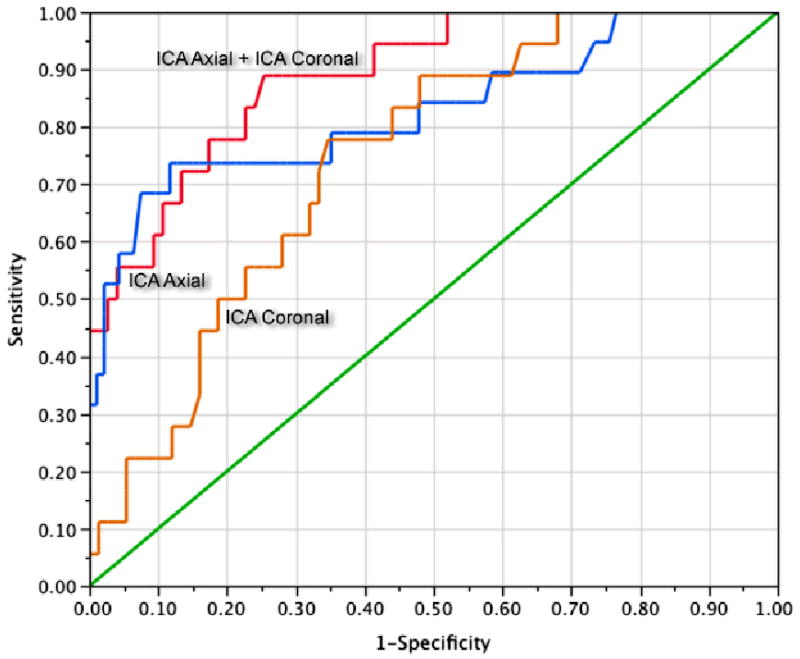
Results: Ninety-four normal fetuses and 19 fetuses with Down syndrome were examined. The ICA-middle and ICA-coronal 2 parameters were the most reproducible angle measurements. The mean +/- SD ICA-middle measurement for fetuses with Down syndrome was significantly greater than that for normal subjects (94.5 +/- 9.8 degrees vs. 83.1 +/- 6.5 degrees ; P < 0.001). The mean +/- SD ICA-coronal 2 angle measurement for fetuses with Down syndrome was slightly greater than that for normal subjects (57.9 +/- 5.5 degrees vs. 51.9 +/- 7.1 degrees ; P = 0.0014). A multiple logistic regression model including ICA-middle and ICA-coronal 2 provided a predictive ability of 88.1% based on the area under the receiver-operating characteristics curve. This combination had a sensitivity of 94.4% for a false-positive rate of 5% in the detection of Down syndrome.
Conclusions: Standardized iliac crest measurements of the fetal pelvis can be used to identify some fetuses at risk for trisomy 21 during the second trimester of pregnancy.
Figures
Similar articles
-
Fetal iliac angle measurements by three-dimensional sonography.Ultrasound Obstet Gynecol. 2001 Aug;18(2):150-4. doi: 10.1046/j.1469-0705.2001.00447.x. Ultrasound Obstet Gynecol. 2001. PMID: 11529996
-
Iliac wing angle as a marker for trisomy 21 in the second trimester.Obstet Gynecol. 1997 May;89(5 Pt 1):734-7. doi: 10.1016/s0029-7844(97)00089-6. Obstet Gynecol. 1997. PMID: 9166311
-
The iliac angle: a sonographic marker of trisomy 21 during the midtrimester: dependency of fetal lying?Eur Radiol. 2003 Sep;13(9):2075-81. doi: 10.1007/s00330-003-1896-6. Epub 2003 Apr 29. Eur Radiol. 2003. PMID: 12720040
-
The second-trimester fetus with Down syndrome: detection using sonographic features.Ultrasound Obstet Gynecol. 1996 Feb;7(2):147-55. doi: 10.1046/j.1469-0705.1996.07020147.x. Ultrasound Obstet Gynecol. 1996. PMID: 8776242 Review.
-
[Echographic signs of trisomy 21 in the second trimester of pregnancy: actual value after analysis of the literature].J Gynecol Obstet Biol Reprod (Paris). 2000 Sep;29(5):445-53. J Gynecol Obstet Biol Reprod (Paris). 2000. PMID: 11011273 Review. French.
Cited by
-
Cartilage formation in the pelvic skeleton during the embryonic and early-fetal period.PLoS One. 2017 Apr 6;12(4):e0173852. doi: 10.1371/journal.pone.0173852. eCollection 2017. PLoS One. 2017. PMID: 28384153 Free PMC article.
-
Hip Dysplasia and Dislocation in Down Syndrome: Is There Evidence to Support Consideration of Routine Hip Surveillance?J Pediatr Soc North Am. 2024 Jun 26;8:100074. doi: 10.1016/j.jposna.2024.100074. eCollection 2024 Aug. J Pediatr Soc North Am. 2024. PMID: 40433006 Free PMC article.
-
Morphometric Study of Subpubic Angle in Human Fetuses.J Clin Diagn Res. 2016 Jan;10(1):AC01-4. doi: 10.7860/JCDR/2016/17699.7051. Epub 2016 Jan 1. J Clin Diagn Res. 2016. PMID: 26894049 Free PMC article.
References
-
- Wapner R, Thom E, Simpson JL, Pergament E, Silver R, Filkins K, et al. First trimester screening for trisomies 21 and 18. N Engl J Med. 2003;349:1405–13. - PubMed
-
- Wald NJ, Rodeck C, Hackshaw AK, Walters J, Chitty L, Mackinson AM. First and second trimester antenatal screening for Down's syndrome: the results of the serum, urine, and ultrasound screening study (SURUSS) J Med Screen. 2003;10:56–104. - PubMed
-
- Malone FD, Canick JA, Ball RH, Nyberg DA, Comstock CH, Bukowski R, et al. First-trimester or second-trimester screening, or both, for Down's syndrome. N Engl J Med. 2005;353:2001–11. - PubMed
-
- Benacerraf BR. The role of the second trimester genetic sonogram in screening for fetal Down syndrome. Semin Perinatol. 2005;29:386–94. - PubMed
-
- Hobbins JC, Lezotte DC, Persutte WH, DeVore GR, Benacerraf BR, et al. An 8-center study to evaluate the utility of mid-term genetic sonograms among high-risk pregnancies. J Ultrasound Med. 2003;22:33–8. - PubMed
Publication types
MeSH terms
Grants and funding
LinkOut - more resources
Full Text Sources
Other Literature Sources
Medical
Miscellaneous
