

Heme-coordinating inhibitors of neuronal nitric oxide synthase. Iron-thioether coordination is stabilized by hydrophobic contacts without increased inhibitor potency
- PMID: 20014790
- PMCID: PMC2826131
- DOI: 10.1021/ja908544f
Heme-coordinating inhibitors of neuronal nitric oxide synthase. Iron-thioether coordination is stabilized by hydrophobic contacts without increased inhibitor potency
Abstract
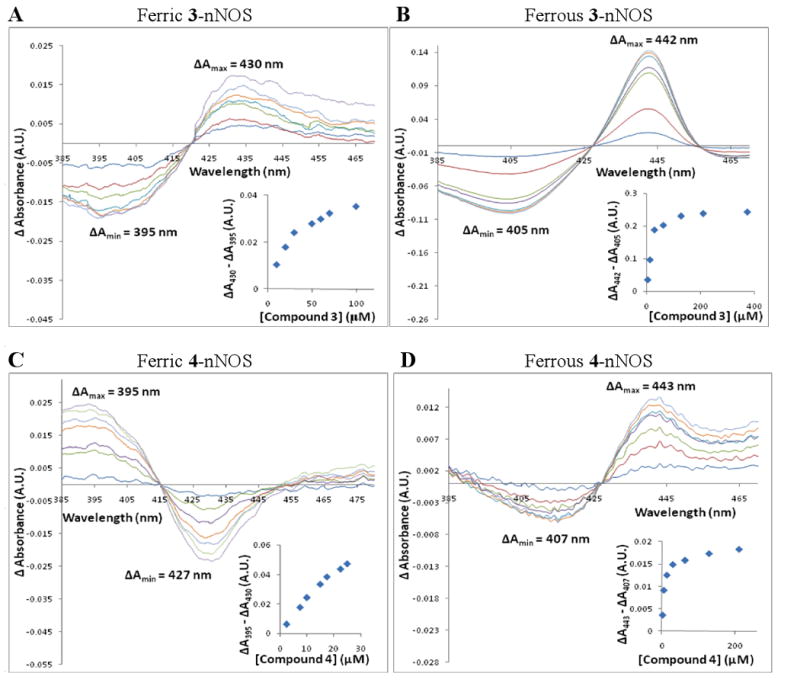
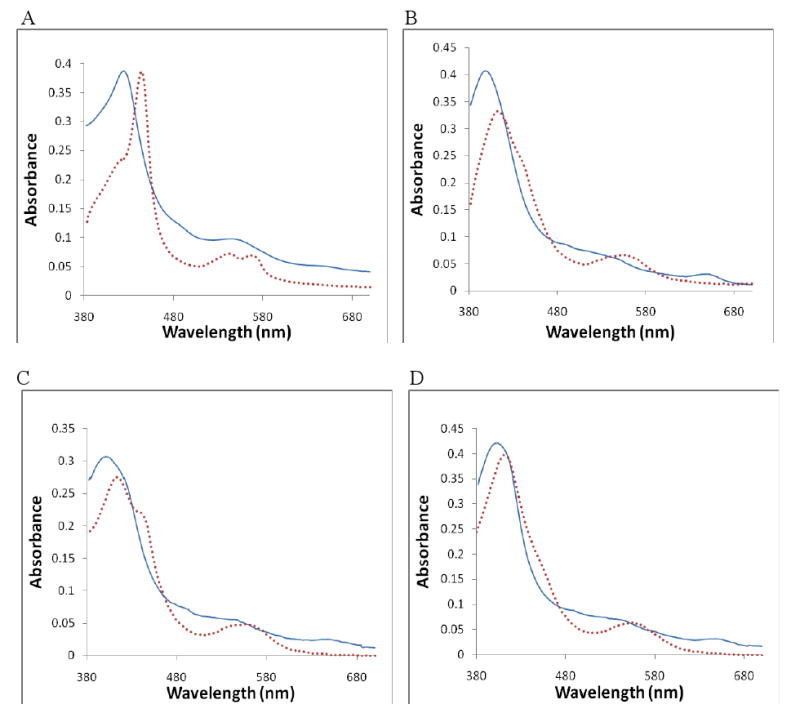
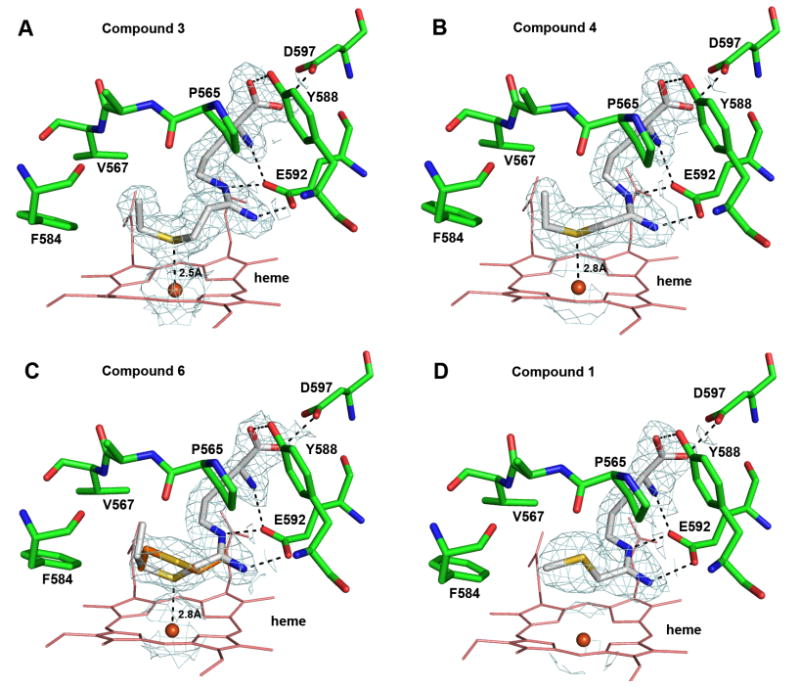
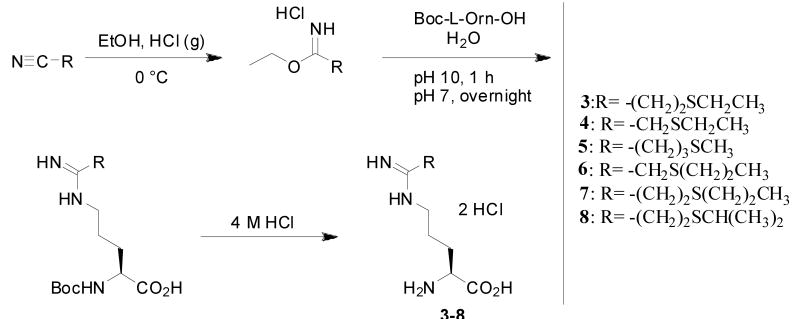
The heme-thioether ligand interaction often occurs between heme iron and native methionine ligands, but thioether-based heme-coordinating (type II) inhibitors are uncommon due to the difficulty in stabilizing the Fe-S bond. Here, a thioether-based inhibitor (3) of neuronal nitric oxide synthase (nNOS) was designed, and its binding was characterized by spectrophotometry and crystallography. A crystal structure of inhibitor 3 coordinated to heme iron was obtained, representing, to our knowledge, the first crystal structure of a thioether inhibitor complexed to any heme enzyme. A series of related potential inhibitors (4-8) also were evaluated. Compounds 4-8 were all found to be type I (non-heme-coordinating) inhibitors of ferric nNOS, but 4 and 6-8 were found to switch to type II upon heme reduction to the ferrous state, reflecting the higher affinity of thioethers for ferrous heme than for ferric heme. Contrary to what has been widely thought, thioether-heme ligation was found not to increase inhibitor potency, illustrating the intrinsic weakness of the thioether-ferric heme linkage. Subtle changes in the alkyl groups attached to the thioether sulfur caused drastic changes in the binding conformation, indicating that hydrophobic contacts play a crucial role in stabilizing the thioether-heme coordination.
Figures
Similar articles
-
Temperature-dependent spin crossover in neuronal nitric oxide synthase bound with the heme-coordinating thioether inhibitors.J Am Chem Soc. 2011 Jun 1;133(21):8326-34. doi: 10.1021/ja201466v. Epub 2011 May 11. J Am Chem Soc. 2011. PMID: 21534614 Free PMC article.
-
Structure-based design and synthesis of N(omega)-nitro-L-arginine-containing peptidomimetics as selective inhibitors of neuronal nitric oxide synthase. Displacement of the heme structural water.J Med Chem. 2007 May 3;50(9):2089-99. doi: 10.1021/jm061305c. Epub 2007 Apr 11. J Med Chem. 2007. PMID: 17425297 Free PMC article.
-
Exploring second coordination sphere effects in nitric oxide synthase.J Biol Inorg Chem. 2016 Dec;21(8):997-1008. doi: 10.1007/s00775-016-1396-1. Epub 2016 Sep 29. J Biol Inorg Chem. 2016. PMID: 27686338 Free PMC article.
-
Recent advances toward improving the bioavailability of neuronal nitric oxide synthase inhibitors.Curr Top Med Chem. 2013;13(7):803-12. doi: 10.2174/1568026611313070003. Curr Top Med Chem. 2013. PMID: 23578024 Free PMC article. Review.
-
Design of selective neuronal nitric oxide synthase inhibitors for the prevention and treatment of neurodegenerative diseases.Acc Chem Res. 2009 Mar 17;42(3):439-51. doi: 10.1021/ar800201v. Acc Chem Res. 2009. PMID: 19154146 Free PMC article. Review.
Cited by
-
Mechanism of Inactivation of Neuronal Nitric Oxide Synthase by (S)-2-Amino-5-(2-(methylthio)acetimidamido)pentanoic Acid.J Am Chem Soc. 2015 May 13;137(18):5980-9. doi: 10.1021/jacs.5b01202. Epub 2015 May 5. J Am Chem Soc. 2015. PMID: 25874809 Free PMC article.
-
Exploring the Potential of Sulfur Moieties in Compounds Inhibiting Steroidogenesis.Biomolecules. 2023 Sep 5;13(9):1349. doi: 10.3390/biom13091349. Biomolecules. 2023. PMID: 37759751 Free PMC article.
-
Mechanism of Nitric Oxide Synthase Regulation: Electron Transfer and Interdomain Interactions.Coord Chem Rev. 2012 Feb 1;256(3-4):393-411. doi: 10.1016/j.ccr.2011.10.011. Epub 2011 Oct 17. Coord Chem Rev. 2012. PMID: 22523434 Free PMC article.
-
Dissecting regulation mechanism of the FMN to heme interdomain electron transfer in nitric oxide synthases.J Inorg Biochem. 2014 Jan;130:130-40. doi: 10.1016/j.jinorgbio.2013.09.005. Epub 2013 Sep 13. J Inorg Biochem. 2014. PMID: 24084585 Free PMC article. Review.
-
Role of an isoform-specific substrate access channel residue in CO ligand accessibilities of neuronal and inducible nitric oxide synthase isoforms.Biochim Biophys Acta. 2011 Mar;1814(3):405-8. doi: 10.1016/j.bbapap.2010.11.007. Epub 2010 Dec 10. Biochim Biophys Acta. 2011. PMID: 21146639 Free PMC article.
References
-
- Tezcan FA, Winkler JR, Gray HB. J Am Chem Soc. 1998;120:13383–13388.
-
- Voegtle, et al. Biochemistry. 2003;42:2475–2484. - PubMed
-
- Murray SG, Hartley FR. Chem Rev. 1981;81:365–414.
-
- Smith M, McLendon G. J Am Chem Soc. 1981;103:4912–4921.
Publication types
MeSH terms
Substances
Grants and funding
LinkOut - more resources
Full Text Sources
Medical
Miscellaneous
