Comparative Study
. 2010 Feb 5;9(2):1032-40.
doi: 10.1021/pr900927y.

Comparison of extensive protein fractionation and repetitive LC-MS/MS analyses on depth of analysis for complex proteomes

Affiliations
Free PMC article
Comparative Study

Comparison of extensive protein fractionation and repetitive LC-MS/MS analyses on depth of analysis for complex proteomes

Huan Wang et al. J Proteome Res. .
Free PMC article

Abstract

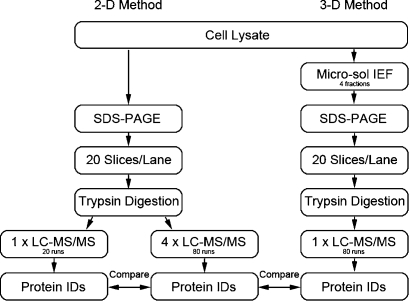
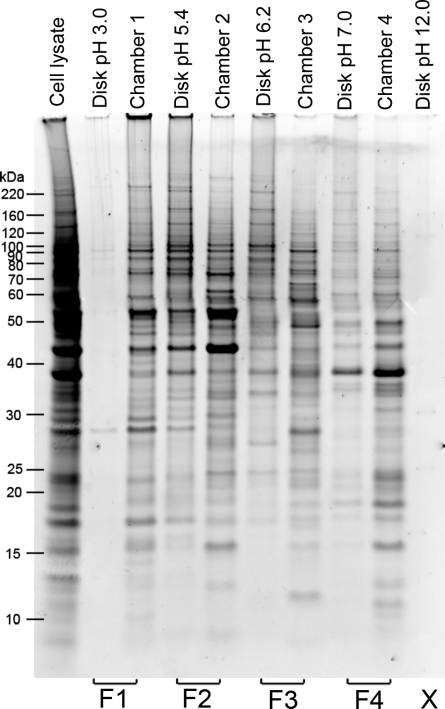
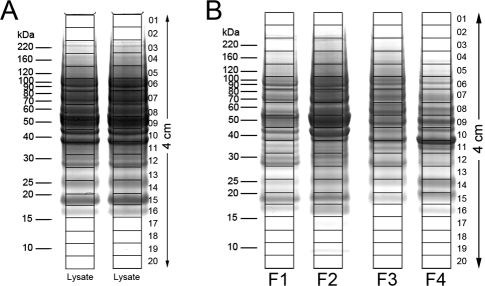
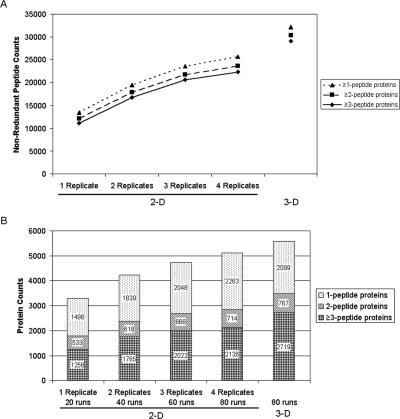
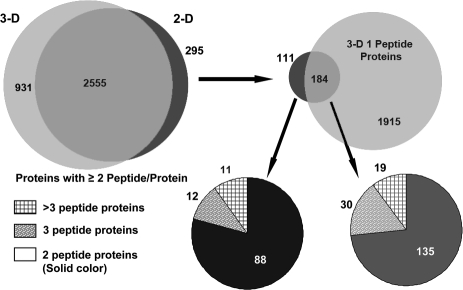
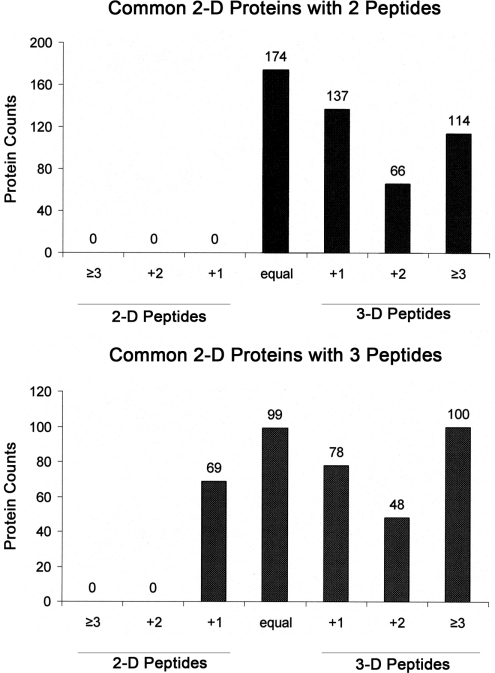
In-depth, reproducible coverage of complex proteomes is challenging because the complexity of tryptic digests subjected to LC-MS/MS analysis frequently exceeds mass spectrometer analytical capacity, which results in undersampling of data. In this study, we used cancer cell lysates to systematically compare the commonly used GeLC-MS/MS (1-D protein + 1-D peptide separation) method using four repetitive injections (2-D/repetitive) with a 3-D method that included solution isoelectric focusing and involved an equal number of LC-MS/MS runs. The 3-D method detected substantially more unique peptides and proteins, including higher numbers of unique peptides from low-abundance proteins, demonstrating that additional fractionation at the protein level is more effective than repetitive analyses at overcoming LC-MS/MS undersampling. Importantly, more than 90% of the 2-D/repetitive protein identifications were found in the 3-D method data in a direct protein level comparison, and the reproducibility between data sets increased to greater than 96% when factors such as database redundancy and use of rigid scoring thresholds were considered. Hence, high reproducibility of complex proteomes, such as human cancer cell lysates, readily can be achieved when using multidimensional separation methods with good depth of analysis.


Figures

Figure 1
Figure 1
Experiment outline. A cell lysate of 1205Lu cell line was processed in such a manner that each common step was comparable. Details of the methods are described in the Materials and Methods. The 2-D method consisted of SDS-PAGE and LC-MS/MS. The same samples were reanalyzed another three times as a repetitive analysis strategy. The 3-D method consisted of MicroSol IEF, SDS-PAGE, and LC-MS/MS. Subsequently, the final minimum consensus protein lists from the three data sets were compared to evaluate the ability of enhancing sensitivity of repetitive analysis and additional fractionation strategies.
Figure 2
Figure 2
Separation of the melanoma 1205Lu cell extract by MicroSol IEF and pooling to produce four fractions. Equal portions of each fraction and separation membrane disk extract were analyzed by SDS-PAGE to evaluate separation and relative amounts of total protein in each fraction. The solution recovered from individual chambers was pooled with the adjacent membrane disk extract on the low pH side of the pool, as shown at the bottom of the gel, to produce four fractions. The extract from the pH 12 membrane disk had negligible protein and was not used further.
Figure 3
Figure 3
SDS-PAGE separation of melanoma 1205Lu cell lysate and MicroSol fractions for proteome analysis. Samples were electrophoresed until the tracking dye migrated 4 cm; gels were stained with Colloidal Coomassie and individual lanes were cut into 20 equal-sized slices, as shown. (A) For the 2-D method, the unfractionated lysate of the 1205Lu cells was separated in two lanes (60 μg/lane). The supernatants from corresponding slices in the two lanes were combined after trypsin digestion. (B) MicroSol IEF fractions derived from 120 μg of cell lysate were separated for the 3-D method.
Figure 4
Figure 4
Comparison of peptide and protein coverage for the 2-D and 3-D methods. (A) Nonredundant peptide counts from a single 2-D analysis, combined data from increasing numbers of replicate analyses, and the 3-D method. (B) Corresponding nonredundant protein counts for the same data sets as shown in panel A. The total number of LC-MS/MS runs that each data set contains is shown at the bottom of the figure.
Figure 5
Figure 5
Overlap of identified proteins between the 2-D repetitive and 3-D methods. The two methods identified 2555 common proteins with two or more peptides per protein (90% of the total proteins identified in the smaller 2-D/replicate-run data set). Of the 295 apparently unique proteins in the 2-D method, 184 proteins were identified in the 3-D data set by one peptide. The pie charts in the lower panels show the number of peptide hits for the 2-D method for the proteins that were not directly identified in the 3-D data set (111 proteins or 3.9% of the proteins in the 2-D data set) and those identified by a single peptide in the 3-D data set (183 proteins or 6.5% of the proteins in the 2-D data set).
Figure 6
Figure 6
Comparison of the number of peptides identified in the 2-D/repetitive and 3-D methods. (A) Among proteins common to both data sets, 491 proteins were identified by two peptides in the 2-D/repetitive data set. The 3-D method found an equal number of peptides for 174 proteins and more peptides for 317 proteins. (B) Among 394 proteins identified with three peptides by the 2-D method, the 3-D method found one less peptide for 69 proteins (i.e., +1 for 2-D), an equal number of peptides for 99 proteins, and more peptides for 226 proteins.

Similar articles

Cited by

References

    1. Cravatt B. F.; Simon G. M.; Yates J. R. III. The biological impact of mass-spectrometry-based proteomics. Nature 2007, 450 (7172), 991–1000. - PubMed
    1. Pasini E. M.; Kirkegaard M.; Salerno D.; Mortensen P.; Mann M.; Thomas A. W. Deep coverage mouse red blood cell proteome: a first comparison with the human red blood cell. Mol. Cell. Proteomics 2008, 7 (7), 1317–30. - PubMed
    1. Dieguez-Acuna F. J.; Gerber S. A.; Kodama S.; Elias J. E.; Beausoleil S. A.; Faustman D.; Gygi S. P. Characterization of mouse spleen cells by subtractive proteomics. Mol. Cell. Proteomics 2005, 4 (10), 1459–70. - PubMed
    1. Omenn G. S.; States D. J.; Adamski M.; Blackwell T. W.; Menon R.; Hermjakob H.; Apweiler R.; Haab B. B.; Simpson R. J.; Eddes J. S.; Kapp E. A.; Moritz R. L.; Chan D. W.; Rai A. J.; Admon A.; Aebersold R.; Eng J.; Hancock W. S.; Hefta S. A.; Meyer H.; Paik Y. K.; Yoo J. S.; Ping P.; Pounds J.; Adkins J.; Qian X.; Wang R.; Wasinger V.; Wu C. Y.; Zhao X.; Zeng R.; Archakov A.; Tsugita A.; Beer I.; Pandey A.; Pisano M.; Andrews P.; Tammen H.; Speicher D. W.; Hanash S. M. Overview of the HUPO Plasma Proteome Project: results from the pilot phase with 35 collaborating laboratories and multiple analytical groups, generating a core dataset of 3020 proteins and a publicly-available database. Proteomics 2005, 5 (13), 3226–45. - PubMed
    1. Chen E. I.; Hewel J.; Felding-Habermann B.; Yates J. R. III. Large scale protein profiling by combination of protein fractionation and multidimensional protein identification technology (MudPIT). Mol. Cell. Proteomics 2006, 5 (1), 53–6. - PubMed

Publication types