

Temporal relationship of autophagy and apoptosis in neurons challenged by low molecular weight β-amyloid peptide
- PMID: 20015199
- PMCID: PMC3822792
- DOI: 10.1111/j.1582-4934.2009.00990.x
Temporal relationship of autophagy and apoptosis in neurons challenged by low molecular weight β-amyloid peptide
Abstract
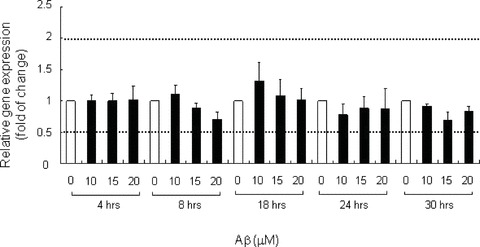
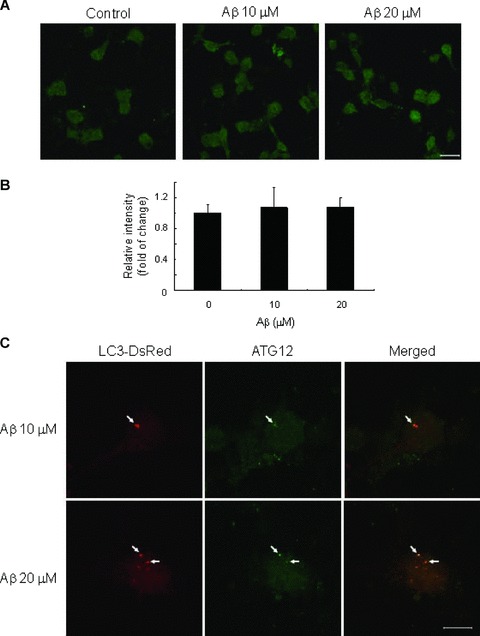
Alzheimer's disease (AD) is an aging-related progressive neurodegenerative disorder. Previous studies suggested that various soluble Aβ species are neurotoxic and able to activate apoptosis and autophagy, the type I and type II programmed cell death, respectively. However, the sequential and functional relationships between these two cellular events remain elusive. Here we report that low molecular weight Aβ triggered cleavage of caspase 3 and poly (ADP-ribose) polymerase to cause neuronal apoptosis in rat cortical neurons. On the other hand, Aβ activated autophagy by inducing autophagic vesicle formation and autophagy related gene 12 (ATG12), and up-regulated the lysoso-mal machinery for the degradation of autophagosomes. Moreover, we demonstrated that activation of autophagy by Aβ preceded that of apoptosis, with death associated protein kinase phosphorylation as the potential molecular link. More importantly, under Aβ toxicity, neurons exhibiting high level of autophagosome formation were absent of apoptotic features, and inhibition of autophagy by 3-methylade-nine advanced neuronal apoptosis, suggesting that autophagy can protect neurons from Aβ-induced apoptosis.
© 2011 The Authors Journal of Cellular and Molecular Medicine © 2011 Foundation for Cellular and Molecular Medicine/Blackwell Publishing Ltd.
Figures


Similar articles
-
Pycnogenol protects neurons from amyloid-beta peptide-induced apoptosis.Brain Res Mol Brain Res. 2002 Jul 15;104(1):55-65. doi: 10.1016/s0169-328x(02)00263-2. Brain Res Mol Brain Res. 2002. PMID: 12117551
-
Tribbles Pseudokinase 3 Induces Both Apoptosis and Autophagy in Amyloid-β-induced Neuronal Death.J Biol Chem. 2017 Feb 17;292(7):2571-2585. doi: 10.1074/jbc.M116.744730. Epub 2016 Dec 23. J Biol Chem. 2017. PMID: 28011637 Free PMC article.
-
Hyperoside protects primary rat cortical neurons from neurotoxicity induced by amyloid β-protein via the PI3K/Akt/Bad/Bcl(XL)-regulated mitochondrial apoptotic pathway.Eur J Pharmacol. 2011 Dec 15;672(1-3):45-55. doi: 10.1016/j.ejphar.2011.09.177. Epub 2011 Sep 29. Eur J Pharmacol. 2011. PMID: 21978835
-
Impaired autophagy and APP processing in Alzheimer's disease: The potential role of Beclin 1 interactome.Prog Neurobiol. 2013 Jul-Aug;106-107:33-54. doi: 10.1016/j.pneurobio.2013.06.002. Epub 2013 Jul 1. Prog Neurobiol. 2013. PMID: 23827971 Review.
-
Amyloid Beta and Phosphorylated Tau-Induced Defective Autophagy and Mitophagy in Alzheimer's Disease.Cells. 2019 May 22;8(5):488. doi: 10.3390/cells8050488. Cells. 2019. PMID: 31121890 Free PMC article. Review.
Cited by
-
Amyloid β peptides promote autophagy-dependent differentiation of mouse neural stem cells: Aβ-mediated neural differentiation.Mol Neurobiol. 2013 Dec;48(3):829-40. doi: 10.1007/s12035-013-8471-1. Epub 2013 Jun 2. Mol Neurobiol. 2013. PMID: 23729317
-
Autophagic activity in neuronal cell death.Neurosci Bull. 2015 Aug;31(4):382-94. doi: 10.1007/s12264-015-1528-y. Epub 2015 Jun 15. Neurosci Bull. 2015. PMID: 26077705 Free PMC article. Review.
-
Autophagy, EVs, and Infections: A Perfect Question for a Perfect Time.Front Cell Infect Microbiol. 2018 Oct 18;8:362. doi: 10.3389/fcimb.2018.00362. eCollection 2018. Front Cell Infect Microbiol. 2018. PMID: 30406039 Free PMC article. Review.
-
Protective effects of testosterone on presynaptic terminals against oligomeric β-amyloid peptide in primary culture of hippocampal neurons.Biomed Res Int. 2014;2014:103906. doi: 10.1155/2014/103906. Epub 2014 Jun 18. Biomed Res Int. 2014. PMID: 25045655 Free PMC article.
-
Toll-interacting protein deficiency promotes neurodegeneration via impeding autophagy completion in high-fat diet-fed ApoE-/- mouse model.Brain Behav Immun. 2017 Jan;59:200-210. doi: 10.1016/j.bbi.2016.10.002. Epub 2016 Oct 5. Brain Behav Immun. 2017. PMID: 27720815 Free PMC article.
References
Publication types
MeSH terms
Substances
LinkOut - more resources
Full Text Sources
Research Materials
