

Regulation of microRNA biosynthesis and expression in 2102Ep embryonal carcinoma stem cells is mirrored in ovarian serous adenocarcinoma patients
- PMID: 20015364
- PMCID: PMC2805659
- DOI: 10.1186/1757-2215-2-19
Regulation of microRNA biosynthesis and expression in 2102Ep embryonal carcinoma stem cells is mirrored in ovarian serous adenocarcinoma patients
Abstract
Background: Tumours with high proportions of differentiated cells are considered to be of a lower grade to those containing high proportions of undifferentiated cells. This property may be linked to the differentiation properties of stem cell-like populations within malignancies. We aim to identify molecular mechanism associated with the generation of tumours with differing grades from malignant stem cell populations with different differentiation potentials. In this study we assessed microRNA (miRNA) regulation in two populations of malignant Embryonal Carcinoma (EC) stem cell, which differentiate (NTera2) or remain undifferentiated (2102Ep) during tumourigenesis, and compared this to miRNA regulation in ovarian serous carcinoma (OSC) patient samples.
Methods: miRNA expression was assessed in NTera2 and 2102Ep cells in the undifferentiated and differentiated states and compared to that of OSC samples using miRNA qPCR.
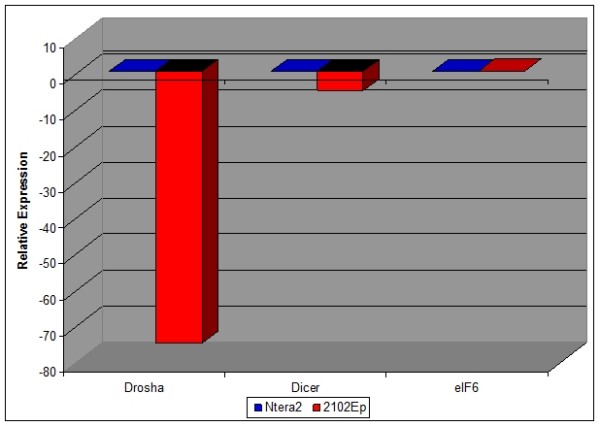
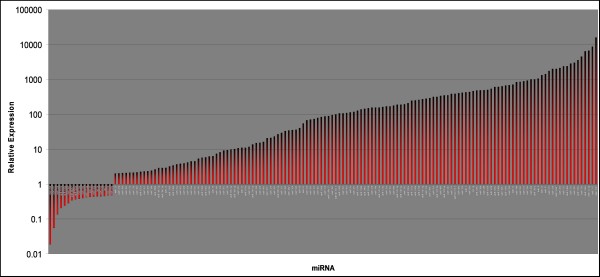
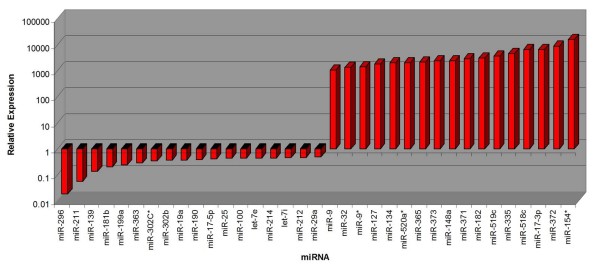
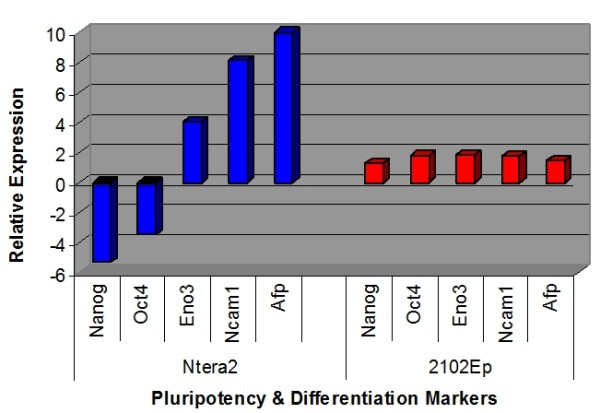
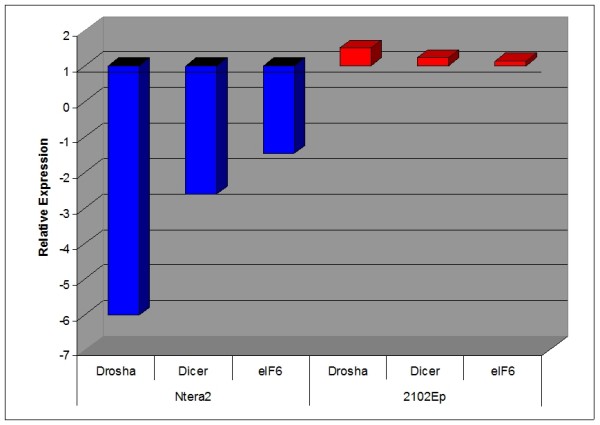
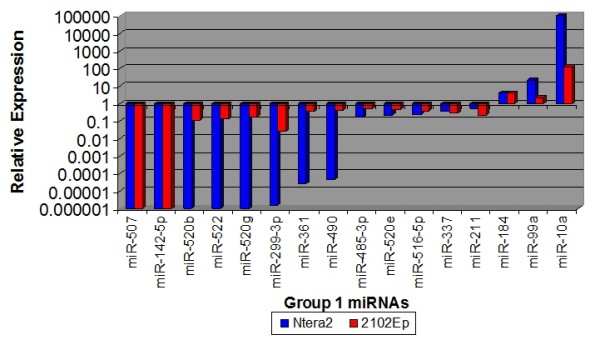
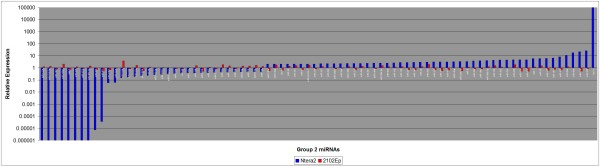
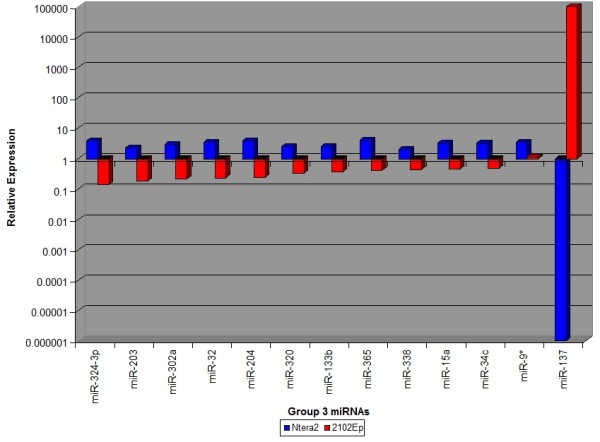
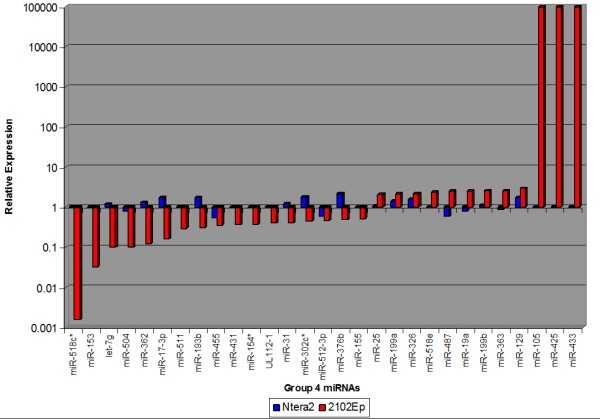
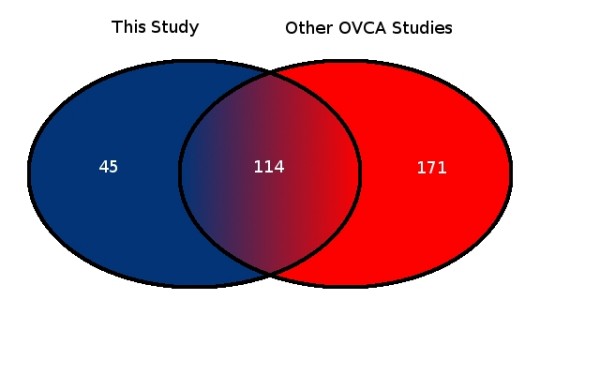
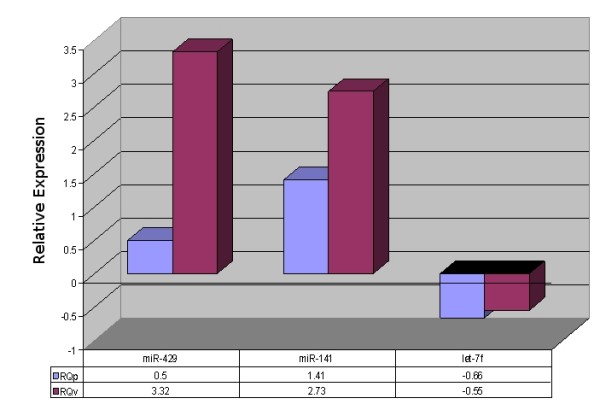
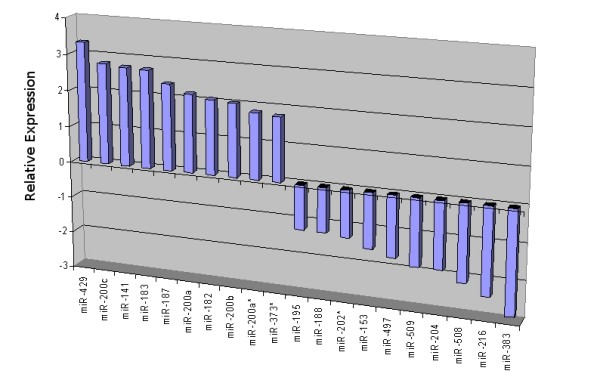
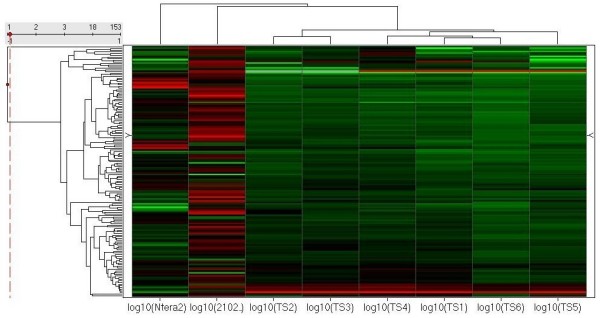
Results: Our analysis reveals a substantial overlap between miRNA regulation in 2102Ep cells and OSC samples in terms of miRNA biosynthesis and expression of mature miRNAs, particularly those of the miR-17/92 family and clustering to chromosomes 14 and 19. In the undifferentiated state 2102Ep cells expressed mature miRNAs at up to 15,000 fold increased levels despite decreased expression of miRNA biosynthesis genes Drosha and Dicer. 2102Ep cells avoid differentiation, which we show is associated with consistent levels of expression of miRNA biosynthesis genes and mature miRNAs while expression of miRNAs clustering to chromosomes 14 and 19 is deemphasised. OSC patient samples displayed decreased expression of miRNA biosynthesis genes, decreased expression of mature miRNAs and prominent clustering to chromosome 14 but not 19. This indicates that miRNA biosynthesis and levels of miRNA expression, particularly from chromosome 14, are tightly regulated both in progenitor cells and in tumour samples.
Conclusion: miRNA biosynthesis and expression of mature miRNAs, particularly the miR-17/92 family and those clustering to chromosomes 14 and 19, are highly regulated in both progenitor cells and tumour samples. Strikingly, 2102Ep cells are not simply malfunctioning but respond to differentiation specifically, a mechanism that is highly relevant to OSC samples. Our identification and future manipulation of these miRNAs may facilitate generation of lower grade malignancies from these high-grade cells.
Figures
Similar articles
-
The CDK inhibitor p27 enhances neural differentiation in pluripotent NTERA2 human EC cells, but does not permit differentiation of 2102Ep nullipotent human EC cells.Mech Dev. 2005 Sep;122(9):1034-42. doi: 10.1016/j.mod.2005.04.011. Mech Dev. 2005. PMID: 16023837
-
MiRNA expression signature for potentially predicting the prognosis of ovarian serous carcinoma.Tumour Biol. 2013 Dec;34(6):3501-8. doi: 10.1007/s13277-013-0928-3. Epub 2013 Jul 9. Tumour Biol. 2013. PMID: 23836287
-
Micro-RNA expression in cisplatin resistant germ cell tumor cell lines.Mol Cancer. 2011 May 15;10:52. doi: 10.1186/1476-4598-10-52. Mol Cancer. 2011. PMID: 21575166 Free PMC article.
-
MicroRNA regulation and role in stem cell maintenance, cardiac differentiation and hypertrophy.Curr Mol Med. 2013 Jun;13(5):757-64. doi: 10.2174/1566524011313050007. Curr Mol Med. 2013. PMID: 23642057 Free PMC article. Review.
-
Regulation of the MIR155 host gene in physiological and pathological processes.Gene. 2013 Dec 10;532(1):1-12. doi: 10.1016/j.gene.2012.12.009. Epub 2012 Dec 14. Gene. 2013. PMID: 23246696 Review.
Cited by
-
Adipose tissue-derived stem cell in vitro differentiation in a three-dimensional dental bud structure.Am J Pathol. 2011 May;178(5):2299-310. doi: 10.1016/j.ajpath.2011.01.055. Am J Pathol. 2011. PMID: 21514442 Free PMC article.
-
Developing ovarian cancer stem cell models: laying the pipeline from discovery to clinical intervention.Mol Cancer. 2014 Dec 11;13:262. doi: 10.1186/1476-4598-13-262. Mol Cancer. 2014. PMID: 25495823 Free PMC article. Review.
-
Application of microRNA in diagnosis and treatment of ovarian cancer.Biomed Res Int. 2014;2014:232817. doi: 10.1155/2014/232817. Epub 2014 Apr 15. Biomed Res Int. 2014. PMID: 24822185 Free PMC article. Review.
-
MicroRNA expression in ovarian carcinoma and its correlation with clinicopathological features.World J Surg Oncol. 2012 Aug 27;10:174. doi: 10.1186/1477-7819-10-174. World J Surg Oncol. 2012. PMID: 22925189 Free PMC article.
-
Suppression of cancer stemness p21-regulating mRNA and microRNA signatures in recurrent ovarian cancer patient samples.J Ovarian Res. 2012 Jan 19;5(1):2. doi: 10.1186/1757-2215-5-2. J Ovarian Res. 2012. PMID: 22260314 Free PMC article.
References
-
- Prince ME, Sivanandan R, Kaczorowski A, Wolf GT, Kaplan MJ, Dalerba P, Weissman IL, Clarke MF, Allies LE. Identification of a subpopulation of cells with cancer stem cell properties in head and neck squamous cell carcinoma. PNAS. 2007;104(3):973–978. doi: 10.1073/pnas.0610117104. - DOI - PMC - PubMed
-
- Szotek P, Pieretti-Vanmarke R, Masiakos PT, Dinulescu DM, Connolly D, Foster R, Dombkowski D, Preffer F, MacLaughlin DT, Donahoe PK. Ovarian cancer side population defines cells with stem-like characteristics and Mullerian Inhibiting Substance responsiveness. PNAS. 2006;103(30):11154–11159. doi: 10.1073/pnas.0603672103. - DOI - PMC - PubMed
LinkOut - more resources
Full Text Sources
Other Literature Sources
