

Modeling the risk of malaria for travelers to areas with stable malaria transmission
- PMID: 20015392
- PMCID: PMC2806379
- DOI: 10.1186/1475-2875-8-296
Modeling the risk of malaria for travelers to areas with stable malaria transmission
Abstract
Background: Malaria is an important threat to travelers visiting endemic regions. The risk of acquiring malaria is complex and a number of factors including transmission intensity, duration of exposure, season of the year and use of chemoprophylaxis have to be taken into account estimating risk.
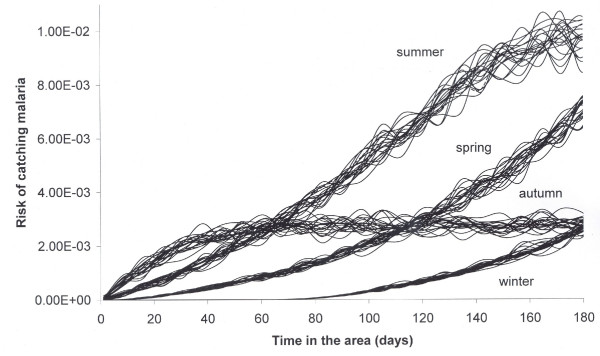
Materials and methods: A mathematical model was developed to estimate the risk of non-immune individual acquiring falciparum malaria when traveling to the Amazon region of Brazil. The risk of malaria infection to travelers was calculated as a function of duration of exposure and season of arrival.
Results: The results suggest significant variation of risk for non-immune travelers depending on arrival season, duration of the visit and transmission intensity. The calculated risk for visitors staying longer than 4 months during peak transmission was 0.5% per visit.
Conclusions: Risk estimates based on mathematical modeling based on accurate data can be a valuable tool in assessing risk/benefits and cost/benefits when deciding on the value of interventions for travelers to malaria endemic regions.
Figures

Similar articles
-
Cost risk benefit analysis to support chemoprophylaxis policy for travellers to malaria endemic countries.Malar J. 2011 May 17;10:130. doi: 10.1186/1475-2875-10-130. Malar J. 2011. PMID: 21586155 Free PMC article.
-
The risk of malaria infection for travelers visiting the Brazilian Amazonian region: A mathematical modeling approach.Travel Med Infect Dis. 2020 Sep-Oct;37:101792. doi: 10.1016/j.tmaid.2020.101792. Epub 2020 Aug 6. Travel Med Infect Dis. 2020. PMID: 32771653 Free PMC article.
-
Risk estimates of dengue in travelers to dengue endemic areas using mathematical models.J Travel Med. 2009 May-Jun;16(3):191-3. doi: 10.1111/j.1708-8305.2009.00310.x. Epub 2009 May 5. J Travel Med. 2009. PMID: 19538580
-
The 2014 FIFA World Cup: communicable disease risks and advice for visitors to Brazil--a review from the Latin American Society for Travel Medicine (SLAMVI).Travel Med Infect Dis. 2014 May-Jun;12(3):208-18. doi: 10.1016/j.tmaid.2014.04.004. Epub 2014 Apr 25. Travel Med Infect Dis. 2014. PMID: 24821081 Review.
-
Prevention of malaria in long-term travelers.JAMA. 2006 Nov 8;296(18):2234-44. doi: 10.1001/jama.296.18.2234. JAMA. 2006. PMID: 17090770 Review.
Cited by
-
Modelling the risk of transfusion transmission from travelling donors.BMC Infect Dis. 2016 Apr 1;16:143. doi: 10.1186/s12879-016-1452-z. BMC Infect Dis. 2016. PMID: 27038919 Free PMC article.
-
Cost risk benefit analysis to support chemoprophylaxis policy for travellers to malaria endemic countries.Malar J. 2011 May 17;10:130. doi: 10.1186/1475-2875-10-130. Malar J. 2011. PMID: 21586155 Free PMC article.
-
Estimating the optimal control of zoonotic visceral leishmaniasis by the use of a mathematical model.ScientificWorldJournal. 2013 Aug 5;2013:810380. doi: 10.1155/2013/810380. eCollection 2013. ScientificWorldJournal. 2013. PMID: 23990761 Free PMC article.
-
Seasonality of Plasmodium falciparum transmission: a systematic review.Malar J. 2015 Sep 15;14:343. doi: 10.1186/s12936-015-0849-2. Malar J. 2015. PMID: 26370142 Free PMC article.
-
Equilibrium analysis of a yellow Fever dynamical model with vaccination.Comput Math Methods Med. 2015;2015:482091. doi: 10.1155/2015/482091. Epub 2015 Mar 5. Comput Math Methods Med. 2015. PMID: 25834634 Free PMC article.
References
-
- WHO. http://www.who.int/ith/countries/bra/en/ Accessed in 29 May 2009.
-
- WHO. http://www.who.int/malaria/wmr2008/malaria.pdf Accessed in 29 May 2009.
-
- Ladislaw JLB. Situação da Malária na Amazônia Legal. Ministário da Saúde. Secretaria de Vigilância em Saúde; 2006.
-
- Ecobrasil. 2008. http://www.ecobrasil.org.br Accessed in 29 May 2009.
-
- Embratur. 2006. http://www.ecoviagem.com.br/ Accessed in 29 May 2009.
Publication types
MeSH terms
LinkOut - more resources
Full Text Sources
Medical
