. 2010 Mar;31(3):496-503.
doi: 10.1093/carcin/bgp314. Epub 2009 Dec 16.

The Bmi-1 polycomb protein antagonizes the (-)-epigallocatechin-3-gallate-dependent suppression of skin cancer cell survival

Affiliations

The Bmi-1 polycomb protein antagonizes the (-)-epigallocatechin-3-gallate-dependent suppression of skin cancer cell survival

Sivaprakasam Balasubramanian et al. Carcinogenesis. 2010 Mar.

Abstract

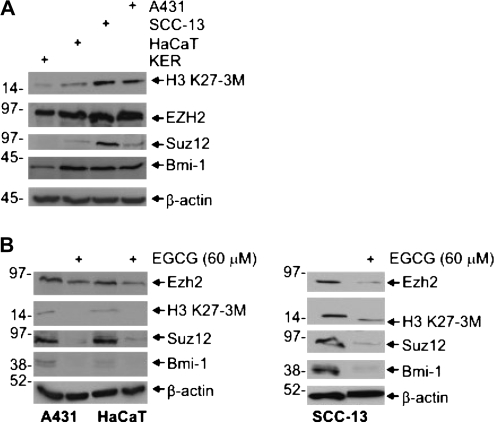
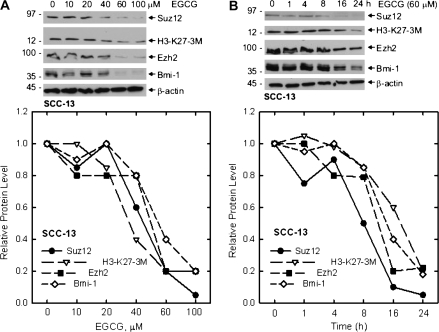
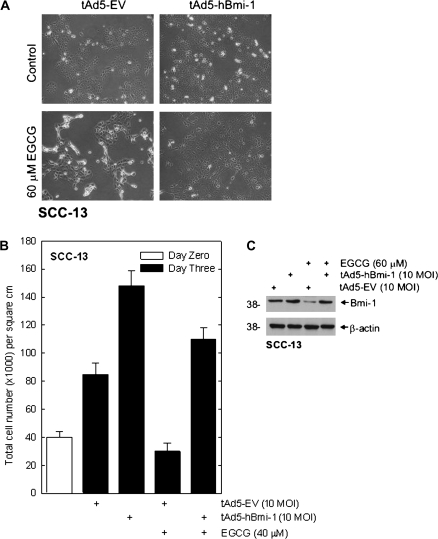
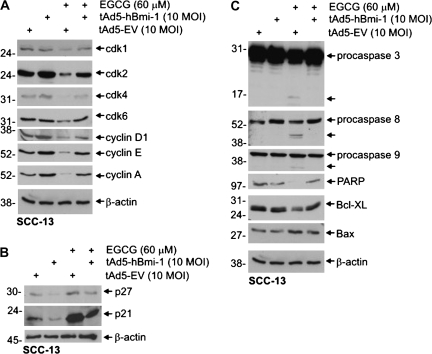
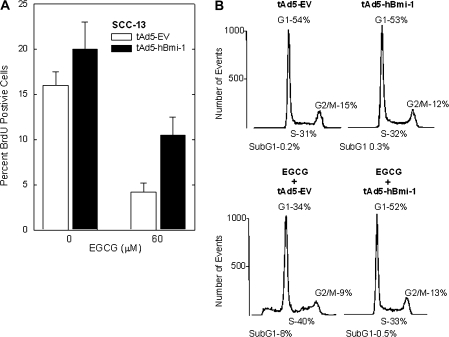
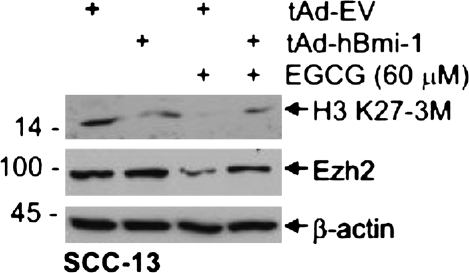
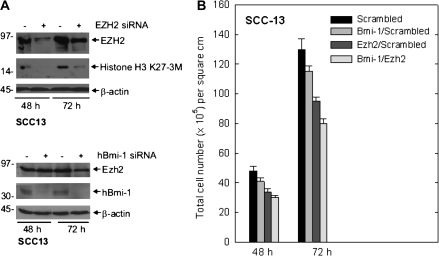
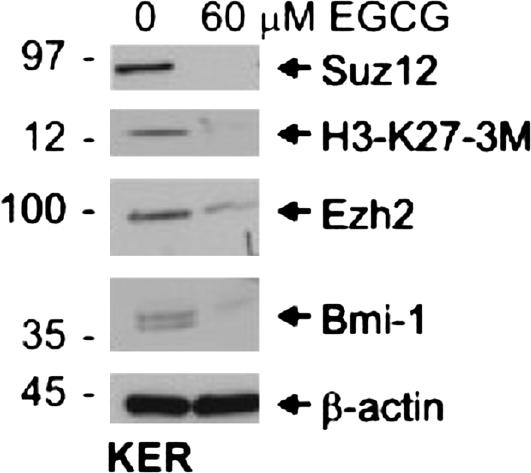
The polycomb group (PcG) proteins are epigenetic regulators of gene expression that enhance cell survival. This regulation is achieved via action of two multiprotein PcG complexes--PRC2 (EED) and PRC1 [B-cell-specific Moloney murine leukemia virus integration site 1 (Bmi-1)]. These complexes modulate gene expression by increasing histone methylation and reducing acetylation--leading to a closed chromatin conformation. Activity of these proteins is associated with increased cell proliferation and survival. We show increased expression of key PcG proteins in immortalized keratinocytes and skin cancer cell lines. We examine the role of two key PcG proteins, Bmi-1 and enhancer of zeste homolog 2 (Ezh2), and the impact of the active agent in green tea, (-)-epigallocatechin-3-gallate (EGCG), on the function of these regulators. EGCG treatment of SCC-13 cells reduces Bmi-1 and Ezh2 level and this is associated with reduced cell survival. The reduction in survival is associated with a global reduction in histone H3 lysine 27 trimethylation, a hallmark of PRC2 complex action. This change in PcG protein expression is associated with reduced expression of key proteins that enhance progression through the cell cycle [cyclin-dependent kinase (cdk)1, cdk2, cdk4, cyclin D1, cyclin E, cyclin A and cyclin B1] and increased expression of proteins that inhibit cell cycle progression (p21 and p27). Apoptosis is also enhanced, as evidenced by increased caspase 9, 8 and 3 cleavage and increased poly(adenosine diphosphate ribose) polymerase cleavage. EGCG treatment also increases Bax and suppresses Bcl-xL expression. Vector-mediated enhanced Bmi-1 expression reverses these EGCG-dependent changes. These findings suggest that green tea polyphenols reduce skin tumor cell survival by influencing PcG-mediated epigenetic regulatory mechanisms.


Figures

Fig. 1.
Fig. 1.
PcG protein and histone H3 K27-3M levels are increased in skin cancer cell lines. (A) Total cell extracts were prepared from subconfluent cultures of normal human epidermal keratinocytes and A431, SCC-13 and HaCaT cells followed by electrophoresis and immunoblot. β-Actin is used as a loading control. Similar results were observed in each of three repeated experiments. (B) PcG protein levels are reduced in EGCG-treated A431, HaCaT and SCC-13 cells. Cells were treated with 0 or 60 μM EGCG for 24 h and extracts were prepared for detection of the indicated markers. Similar results were observed in each of three experiments.
Fig. 2.
Fig. 2.
PcG protein levels are reduced in EGCG-treated SCC-13 cells. (A and B) SCC-13 cells were treated with 0–100 μM EGCG for 24 h or treated with 60 μM EGCG for 0–24 h. Total cell extracts were prepared for electrophoresis on an 8–10% polyacrylamide gel for immunoblot with the indicated antibodies. β-Actin levels were measured to normalize protein loading. The gels were scanned with a densitometer and the data were plotted relative to the control protein level.
Fig. 3.
Fig. 3.
Impact of Bmi-1 and EGCG on cell number. Thirty percent confluent 35 mm dishes of SCC-13 cells were infected with 10 PFU of tAd5-hBmi-1 or tAd5-EV in the presence of 10 PFU Ad5-TA. After 24 h, fresh virus-free medium containing vehicle (DMSO) or 60 μM EGCG was added and incubation was continued for an additional 72 h. (A and B) SCC-13 cell morphology and cell counts. The open bar indicates cell number on day zero at the time of virus infection, and the shaded bars are the cell counts after 72 h of EGCG treatment. The bars in the graphical panel represent the mean ± SEM, n = 3. Student's unpaired t-tests indicate that the tAd5-EV and tAd5-hBmi-1 groups are significantly different (P < 0.001) and that the tAd5-EV/EGCG and tAd5-hBmi-1/EGCG groups are significantly different (P < 0.001). (C) Treatment with EGCG produces a substantial reduction in Bmi-1 level and this is restored by expression of Bmi-1 encoding adenovirus.
Fig. 4.
Fig. 4.
EGCG and Bmi-1 regulate cell cycle and apoptotic endpoints. Thirty percent confluent cultures of SCC-13 cells, growing in 35 mm dishes, were infected with 10 PFU of tAd5-hBmi-1 or tAd5-EV along with 10 PFU Ad5-TA. After 24 h, the cells were treated for an additional 48 h with or without 60 μM EGCG. Total cell extract was prepared and electrophoresed on a 10% polyacrylamide gel for immunoblot detection of the indicated epitopes (AC). β-Actin was included as a loading control. Similar results were observed in three separate experiments. Both surface-attached and floating cells were harvested and included in the immunoblot analysis.
Fig. 5.
Fig. 5.
Impact of EGCG and Bmi-1 on BrdU incorporation and cell cycle distribution in SCC-13 cells. SCC-13 cells were infected with 10 PFU of empty (EV) or hBmi-1-encoding adenovirus. After 24 h, the cells were treated with or without 60 μM EGCG for an additional 48 h. (A) EGCG treatment suppresses BrdU incorporation. Cells, treated with the indicated viruses and EGCG as above, were incubated with 10 μM BrdU during the final 2 h of EGCG treatment and then assayed for BrdU incorporation. The data are the mean ± SD of a representative experiment. (B) Impact of EGCG and Bmi-1 on SCC-13 cell cycle phase. After infection with virus and EGCG treatment as indicated above, the cells were harvested for cell cytometry analysis. The x-axis represents the propidium iodide level (DNA content) and the y-axis, the number of events. The percentage of cells in G1, S, G2/M and subG1 is indicated. Three separate experiments yielded similar results.
Fig. 6.
Fig. 6.
Bmi-1 expression restores Ezh2 expression and H3 K27-3M formation. SCC-13 cells were infected with 10 multiplicity of infection of empty (EV) or hBmi-1-encoding adenovirus. After 24 h, the cells were treated with or without 60 μM EGCG for an additional 48 h. Extracts were prepared for detection of the indicated epitopes. Similar results were observed in each of three separate experiments.
Fig. 7.
Fig. 7.
Bmi-1 and Ezh2 siRNA suppress SCC-13 cell proliferation. SCC-13 cells were electroporated with control (3 μg), Bmi-1/control (1.5 μg each), Ezh2/control siRNAs (1.5 μg each) or Bmi-1/Ezh2 siRNAs (1.5 μg each) using the AMAXA electroporation system and the T-018 electroporation protocol. Cells were then plated in 35 mm dishes and fresh medium was added on alternate days. (A) Extracts were prepared at 48 h post-electroporation for detection of Ezh2, H3 K27-3M, Bmi-1 and β-actin. β-Actin was monitored as a loading control. (B) At the indicated times post-electroporation, cells were harvested for cell count. The bars represent mean ± SEM, n = 3. Student's unpaired t-test indicates that the 72 h scrambled versus Bmi-1/Ezh2 groups are significantly different (P < 0.002).
Fig. 8.
Fig. 8.
EGCG suppresses PcG function in normal human keratinocytes. Normal human keratinocytes were treated for 24 h with 60 μM EGCG and extracts were prepared for detection of the indicated proteins. The level of each marker was reduced by >90% in this experiment when normalized to β-actin. This experiment was repeated three times with essentially identical results.

Comment in

  • Findings of Research Misconduct.
    [No authors listed] [No authors listed] Fed Regist. 2024 Aug 15;89(158):66420-66422. Fed Regist. 2024. PMID: 39161428 Free PMC article. No abstract available.

Similar articles

Cited by

References

    1. Sparmann A, et al. Polycomb silencers control cell fate, development and cancer. Nat. Rev. Cancer. 2006;6:846–856. - PubMed
    1. Vaissiere T, et al. Epigenetic interplay between histone modifications and DNA methylation in gene silencing. Mutat. Res. 2008;659:40–48. - PubMed
    1. Jacobs JJ, et al. Polycomb repression: from cellular memory to cellular proliferation and cancer. Biochim. Biophys. Acta. 2002;1602:151–161. - PubMed
    1. Jacobs JJ, et al. The oncogene and Polycomb-group gene bmi-1 regulates cell proliferation and senescence through the ink4a locus. Nature. 1999;397:164–168. - PubMed
    1. Orlando V. Polycomb, epigenomes, and control of cell identity. Cell. 2003;112:599–606. - PubMed

Publication types

MeSH terms