. 2010 Mar 1;19(5):901-19.
doi: 10.1093/hmg/ddp558. Epub 2009 Dec 16.

Loss of IGF2 imprinting is associated with abrogation of long-range intrachromosomal interactions in human cancer cells

Affiliations

Loss of IGF2 imprinting is associated with abrogation of long-range intrachromosomal interactions in human cancer cells

Thanh H Vu et al. Hum Mol Genet. .

Abstract

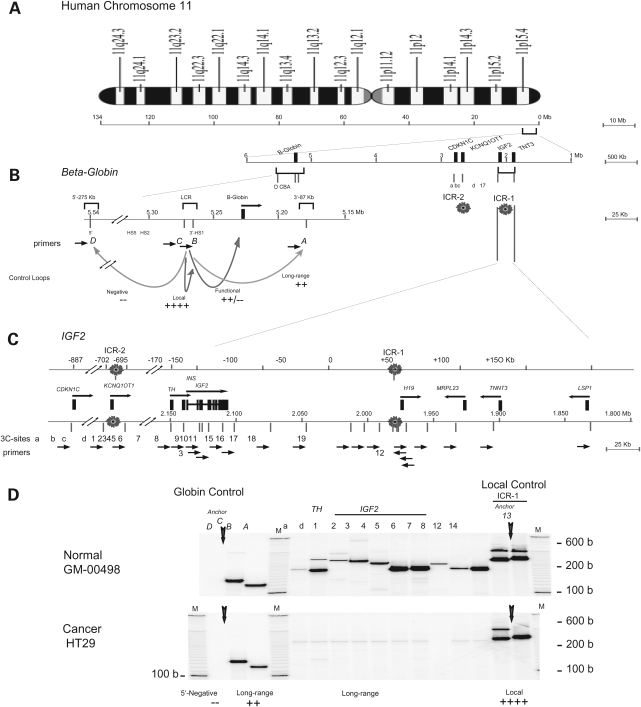
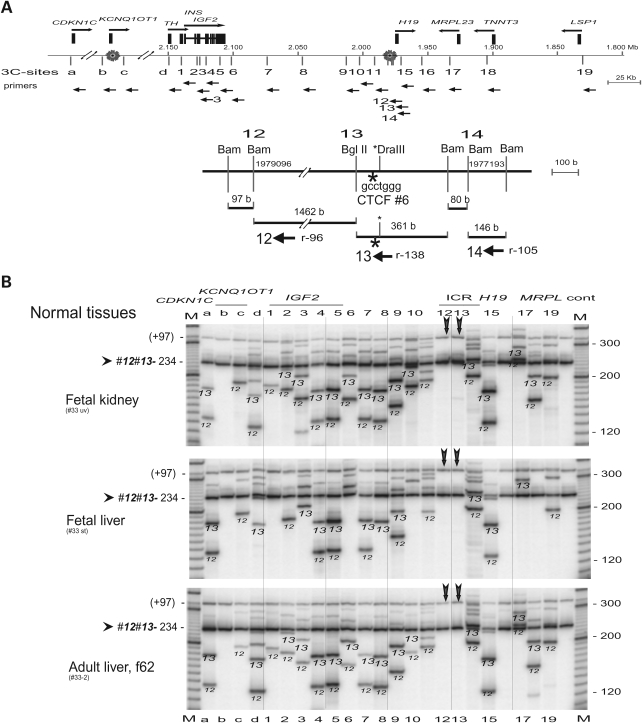
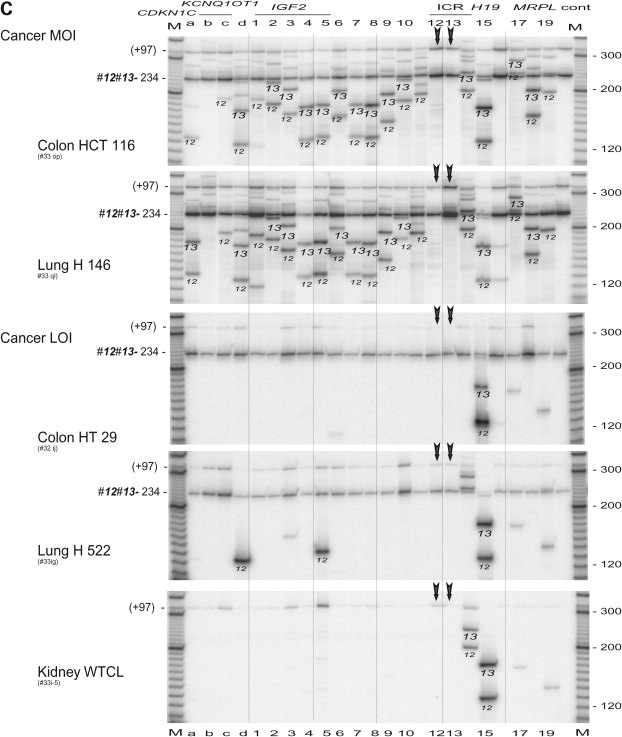
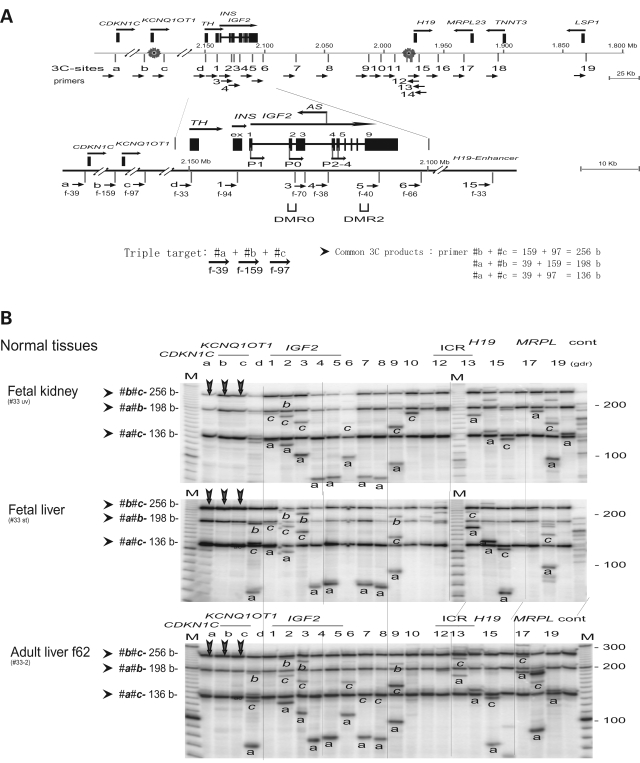
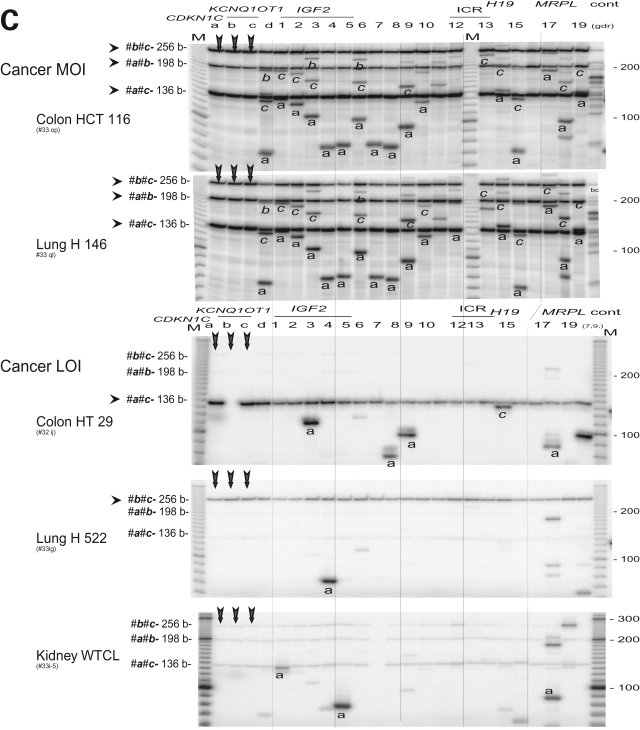
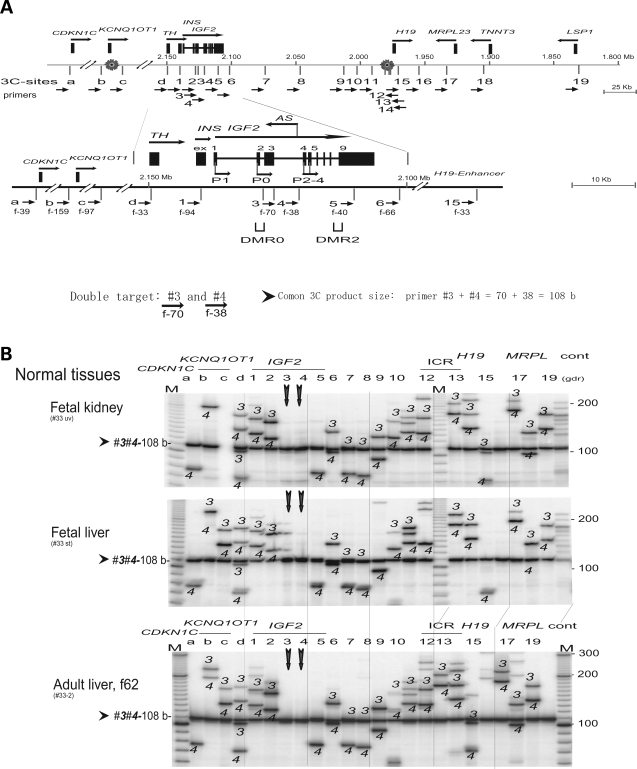
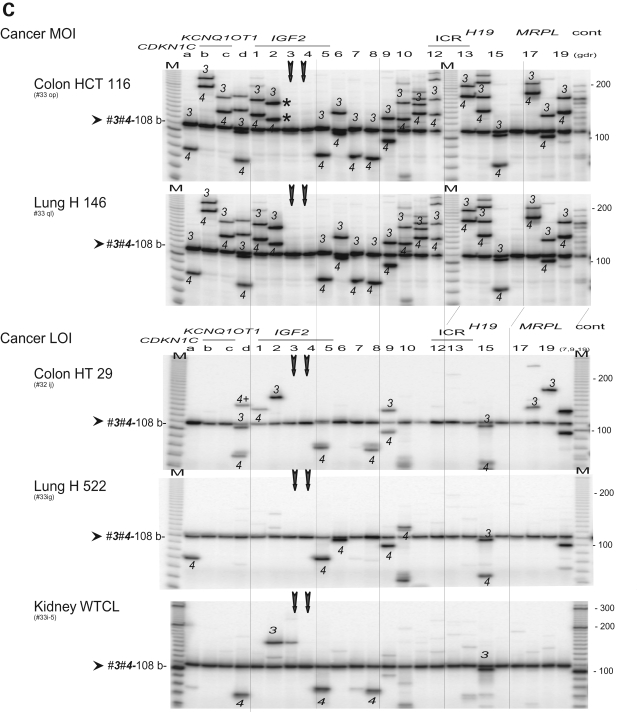
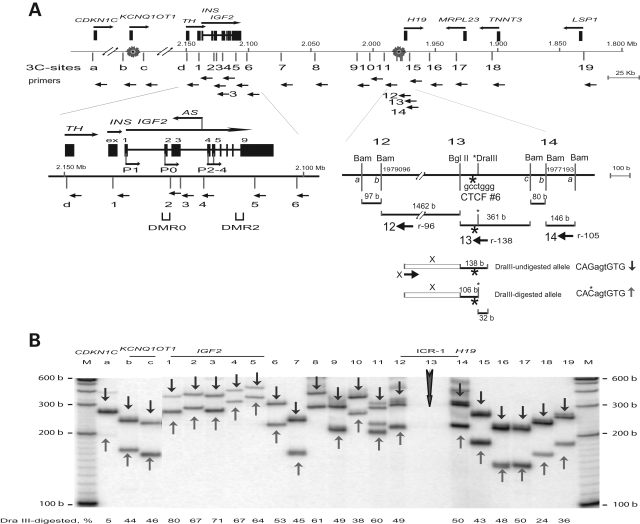
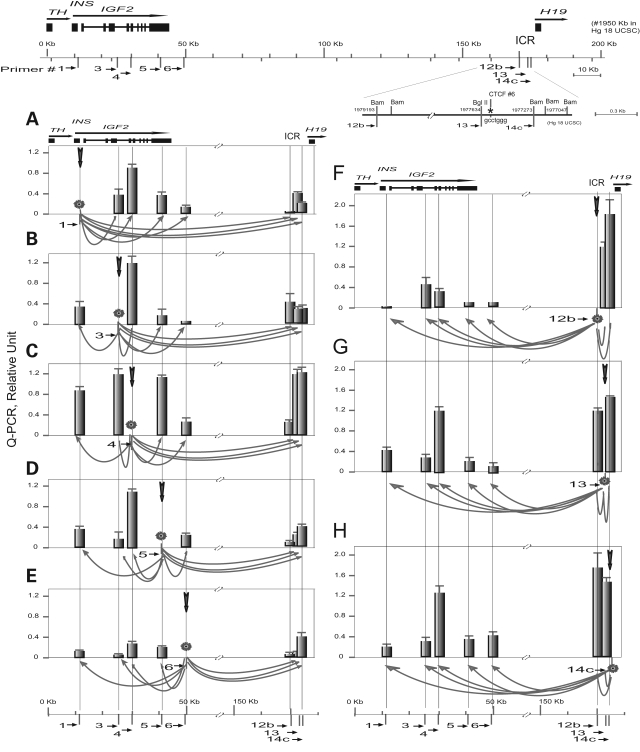
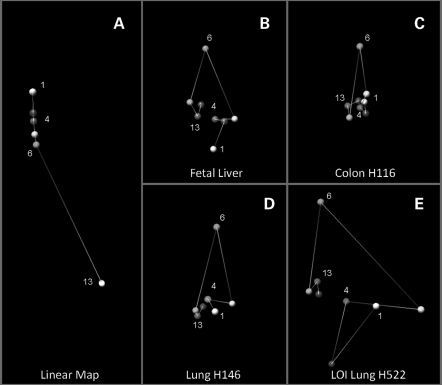
Nuclear architecture and chromatin geography are important factors in the regulation of gene expression, as these components may play a vital epigenetic role both in normal physiology as well as in the initiation and progression of malignancies. Using a modification of the chromosome conformation capture (3C) technique, we examined long-range chromatin interactions of the imprinted human IGF2 gene. We demonstrate that numerous intrachromosomal interactions occur along both parental alleles in normal tissues, where the IGF2 is paternally expressed, as well as in normal liver where gene expression is biallelic. Long-range and allele-specific interactions occur between the IGF2/H19 imprinting control region-1 (ICR1) and ICR2, a region which regulates an imprinted gene cluster nearly a megabase distant from IGF2. Loss of genomic imprinting is a common epigenetic event in cancer, and long-range interactions have not been examined in malignant cells. In cancer cell lines in which IGF2 imprinting is maintained (MOI), essentially all of the 3C interactions seen in normal cells were preserved. However, in cells in which IGF2 imprinting was lost (LOI), nearly all of the long-range chromatin interactions involving IGF2 were abrogated. A three-dimensional computer model depicts the physical interactions between the IGF2 promoter and ICR1 in MOI cells, while the model of LOI lung cancer cells is flattened with few long-range interactions. This dramatic change in the three-dimension configuration of the chromatin at the IGF2 locus in LOI cancer cells suggests that the loss of imprinting may lead to a variety of changes in gene expression in addition to changes in IGF2 transcription.


Figures

Figure 1.
Figure 1.
IGF2 long-range chromosomal interactions in normal fibroblasts and in the HT29 cancer cell line. (A) Human chromosome 11. IGF2/H19 and beta-globin are located within 4 Mb on chromosome 11p15. Two imprinting domains, IGF2/H19 (ICR1) and KCNQ1OT1 (ICR2), are within ∼700 kb of each other. (B) Beta-globin 3C control. Within the globin locus, the locus control region (LCR) interacts with the beta-globin promoter in globin expressing cells, forming a functional active loop [C]-Beta-globin. LCR also interacts with the 3′ HS1 (DNAse I hypersensitivity 1) in normal cells, forming a ‘long-range’ [C-A] (87 kb) loop. A strong local interaction [C-B] (HS5–HS2) serves as a positive control while the absence of interaction between LCR and the 5′ region, [C-D], serves as a negative control. (C) Map of the IGF2/H19 locus. Top line: distance from ICR1 in kilobase. Two imprinting control regions, ICR1 and ICR2, are 700 kb apart. Bottom line: Map of the IGF2/H19 locus and location of 3C primers (Supplementary Material, Table S1). Forward primers (a, d, 1 through 8) and reverse ICR primers (12–14) were used to detect long-range and local chromosome interactions. (D) Chromosomal interactions in GM-00498 and HT29 cells. Control 3C interactions in globin region consists of anchor primer C (vertical arrow) and one of the forward primers A, B and D. Local C-B and long-range C-A interactions were detected in (B) and (A), respectively. Absence of C-D product denotes a negative 3C control in these cells. In the IGF2/H19 region, anchor primer 13 (vertical arrow) formed local 3C products (13-12 and 13-14) in panels 12 and 14 in both GM-0498 and HT29 cells. In GM-00498, but not in HT29 cells, anchor primer 13 in combination with each primers a, d, 1 through 8 formed specific 3C products of expected sizes (Supplementary Material, Table S2). M, 100 b and 10 b DNA markers.
Figure 2.
Figure 2.
Scanning analysis of chromosomal interactions from CTCF-binding region of the H19 DMR. (A) Map of the two imprinted domains. A complete set of reverse primers (orientation by horizontal arrows) was employed in this experiment. Bottom, detailed restriction map of CTCF-binding site 6. Primers are indicated by orientation (r, reverse) and the distance to the symmetric center of the target restriction sites. (B) 3C interactions in normal fetal tissues and adult liver. The anchor primers 12 and 13 (vertical arrows) were used in combination with each target primer shown on top of the panel. Each column shows 3C products from anchor primers (12 or 13, as marked) along with the common 3C product (1213, 96 b + 138 b = 234 b) that is marked by an arrow head. A minor band (+97) is likely derived from a stuffer 97 b BamHI—BamHI fragment upstream of site 12. Columns 12, 13 and control (cont) depict only common 3C products. M, marker. (C) 3C interactions in cancer cell lines with maintenance (MOI) or lack (LOI) of imprinting. See legend in (B). Note sporadic detection of 3C products 12-d and 12-5 in H522 cells, and retention of 3C products in the H19 enhancer region (column 15) in all tissues and cell lines including the LOI cancer cells.
Figure 2.
Figure 2.
Scanning analysis of chromosomal interactions from CTCF-binding region of the H19 DMR. (A) Map of the two imprinted domains. A complete set of reverse primers (orientation by horizontal arrows) was employed in this experiment. Bottom, detailed restriction map of CTCF-binding site 6. Primers are indicated by orientation (r, reverse) and the distance to the symmetric center of the target restriction sites. (B) 3C interactions in normal fetal tissues and adult liver. The anchor primers 12 and 13 (vertical arrows) were used in combination with each target primer shown on top of the panel. Each column shows 3C products from anchor primers (12 or 13, as marked) along with the common 3C product (1213, 96 b + 138 b = 234 b) that is marked by an arrow head. A minor band (+97) is likely derived from a stuffer 97 b BamHI—BamHI fragment upstream of site 12. Columns 12, 13 and control (cont) depict only common 3C products. M, marker. (C) 3C interactions in cancer cell lines with maintenance (MOI) or lack (LOI) of imprinting. See legend in (B). Note sporadic detection of 3C products 12-d and 12-5 in H522 cells, and retention of 3C products in the H19 enhancer region (column 15) in all tissues and cell lines including the LOI cancer cells.
Figure 3.
Figure 3.
Interactions between the two imprinting control regions. (A) Map of the IGF2/H19 locus as shown in Fig. 1C. Bottom, details of the TH-INS-IGF2 locus. IGF2 is transcribed from five promoters (P1, P0 and P2–P4) across nine exons (ex 1–9). The IGF2 DMR is located in exon 9. Three anchor primers a, b and c result in three PCR products (a-b, a-c and b-c); their sizes are determined by the sum of two specified DNA segments. (B) 3C interaction in fetal tissues and adult liver. The anchor primers a, b and c (vertical arrows) show common 3C products and specific products from each anchor primers (marked as a, b and c). Columns a, b and c only contain the triple anchor primers. Cont, control of multiple 3C (unspecified). M, marker. (C) 3C interaction in cancer MOI and LOI cells. Legends are in (B). Note a failed PCR (panel HT29, column ‘b’) that represents <2% of all reactions in our PCR assays.
Figure 3.
Figure 3.
Interactions between the two imprinting control regions. (A) Map of the IGF2/H19 locus as shown in Fig. 1C. Bottom, details of the TH-INS-IGF2 locus. IGF2 is transcribed from five promoters (P1, P0 and P2–P4) across nine exons (ex 1–9). The IGF2 DMR is located in exon 9. Three anchor primers a, b and c result in three PCR products (a-b, a-c and b-c); their sizes are determined by the sum of two specified DNA segments. (B) 3C interaction in fetal tissues and adult liver. The anchor primers a, b and c (vertical arrows) show common 3C products and specific products from each anchor primers (marked as a, b and c). Columns a, b and c only contain the triple anchor primers. Cont, control of multiple 3C (unspecified). M, marker. (C) 3C interaction in cancer MOI and LOI cells. Legends are in (B). Note a failed PCR (panel HT29, column ‘b’) that represents <2% of all reactions in our PCR assays.
Figure 4.
Figure 4.
Scanning analysis of chromosomal interactions from the IGF2 promoter region. (A) Map of the IGF2/H19 locus as shown in Fig. 3A. A set of anchor primers 3 (forward 70 b) and 4 (forward 38 b) in the P0 and P2 promoter region results in one common 3C product (108 b). (B) 3C interaction in fetal tissues and adult liver. The anchor primers 3 and 4 (vertical arrows) produced common 3C product (3-4, 108 b) along with 3C products from primer 3 or 4 (as marked). Note one failed PCR (fetal kidney, column c). (C) 3C interaction in cancer MOI and LOI groups. Legends are in (B).
Figure 4.
Figure 4.
Scanning analysis of chromosomal interactions from the IGF2 promoter region. (A) Map of the IGF2/H19 locus as shown in Fig. 3A. A set of anchor primers 3 (forward 70 b) and 4 (forward 38 b) in the P0 and P2 promoter region results in one common 3C product (108 b). (B) 3C interaction in fetal tissues and adult liver. The anchor primers 3 and 4 (vertical arrows) produced common 3C product (3-4, 108 b) along with 3C products from primer 3 or 4 (as marked). Note one failed PCR (fetal kidney, column c). (C) 3C interaction in cancer MOI and LOI groups. Legends are in (B).
Figure 5.
Figure 5.
Allele-specific interactions from H19 DMR. (A) Map of 3C primers in the ICR1 and ICR2 domains. Legends are in Fig. 2A. Bottom: detailed map of the H19 DMR and location of the polymorphic DraIII site. Primer 13 (r138) spans the DraIII site and the CTCF-binding 6. Amplicon primers 13 and primer x results in a 3C product (138 b + x b). Digestion with DraIII differentiates DraIII digested/undigested alleles (+/−32 b). (B) Allele-specific chromosomal interactions across CDKN1C/IGF2/H19 in normal human skin cells. Human fetal skin-derived fibroblast cell line HFB1 harbors the DraIII polymorphic site. In each column 3C products that were amplified by target primer 13 (vertical arrow) and a specified primer (marked by column number) were radioisotope labeled at the last amplification cycle (hot-stop PCR) and subsequently digested with DraIII. Undigested (downward, vertical arrow) and digested (upward, vertical arrow) products were sized on a polyacrylamide-urea gel and identified by predicted size. PhosphoImager scanning indicates a biased ratio digested/undigested allele of 2/1 in the IGF2 promoter region (1– 4). Note all 3C primers were reverse primers.
Figure 6.
Figure 6.
3C Interactions across 162 kb IGF2/H19 by Q-PCR. Top, Map of IGF2/H19 and detail map of the H19 DMR. Bottom (AH), Q-PCR scanning in fetal liver using anchor primers 1 through 14c. Anchor primer (marked as a star) and target site are linked by an arrow at the bottom of each panel. Relative interaction frequency (IF) values shown in the y-axis are mean values and standard errors from 6 to 8 assays. The IFs are calibrated against a 3C control using BAC and cosmid DNA (8 assays). The x-axis shows genomic distance in kilobase.
Figure 7.
Figure 7.
Three-dimensional model of IGF2/H19. (A) 3D map of the 162 kb linear IGF2/H19 chromosomal segment. Theoretical IFs are calculated from distances between the sites in nucleotide base pair. (BD) 3D configuration of the IGF2/H19 in fetal liver, MOI colon cancer cell line H116 and MOI lung cancer cell line H146. Experimental IFs are derived from 3C Q-PCR data set (such as the one shown in Fig. 6). Each color ball and number denotes the location of the selected site on the IGF2/H19 map. Color bands connecting the balls represents 3D spatial distance while virtually linear DNA length is shown in (A). Chromosome looping to bring the IGF2 promoters (4, red) in close contact to the ICR (13, purple) is evident in fetal liver, H116 and H146 cells. IGF2 LOI correlates with loss of measurable IGF2-H19 long-range interactions and a flattened structure in panel E (H522 cell line).

Similar articles

Cited by

References

    1. DeChiara T.M., Robertson E.J., Efstratiadis A. Parental imprinting of the mouse insulin-like growth factor II gene. Cell. 1991;64:849–859. - PubMed
    1. Bartolomei M.S., Zemel S., Tilghman S.M. Parental imprinting of the mouse H19 gene. Nature. 1991;351:153–155. - PubMed
    1. Zemel S., Bartolomei M.S., Tilghman S.M. Physical linkage of two mammalian imprinted genes, H19 and insulin-like growth factor 2. Nat. Genet. 1992;2:61–65. - PubMed
    1. Giannoukakis N., Deal C., Paquette J., Goodyer C.G., Polychronakos C. Parental genomic imprinting of the human IGF2 gene. Nat. Genet. 1993;4:98–101. - PubMed
    1. Ohlsson R., Nystrom A., Pfeifer O.S., Tohonen V., Hedborg F., Schofield P., Flam F., Ekstrom T.J. IGF2 is parentally imprinted during human embryogenesis and in the Beckwith–Wiedemann syndrome. Nat. Genet. 1993;4:94–97. - PubMed

Publication types