. 2010 Jan;38(Database issue):D204-10.
doi: 10.1093/nar/gkp1019. Epub 2009 Dec 16.

PANTHER version 7: improved phylogenetic trees, orthologs and collaboration with the Gene Ontology Consortium

Affiliations

PANTHER version 7: improved phylogenetic trees, orthologs and collaboration with the Gene Ontology Consortium

Huaiyu Mi et al. Nucleic Acids Res. 2010 Jan.

Abstract

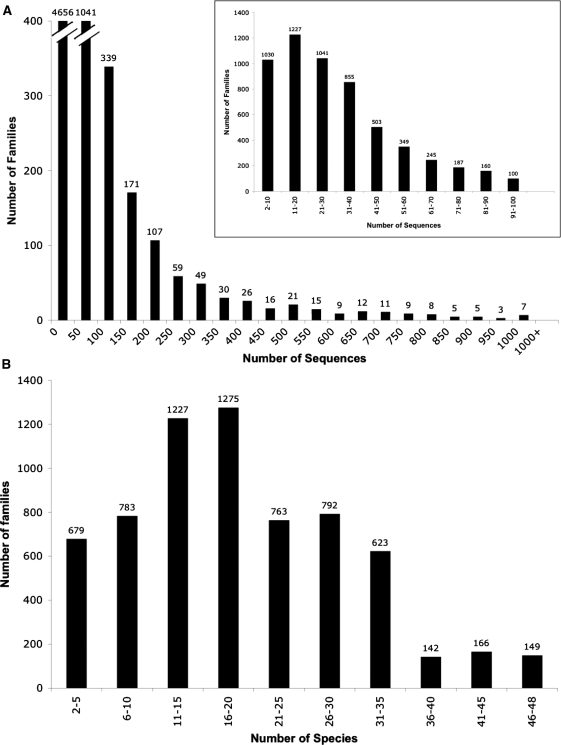
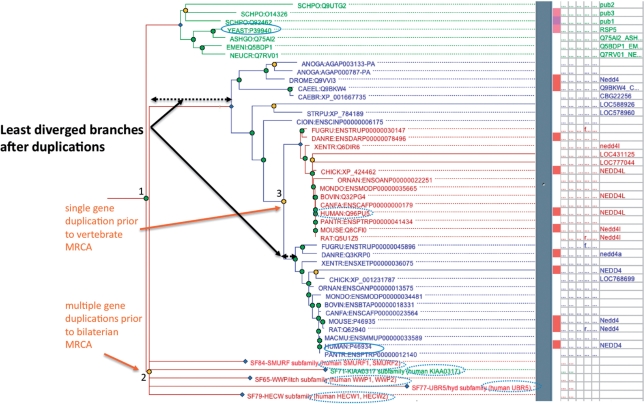
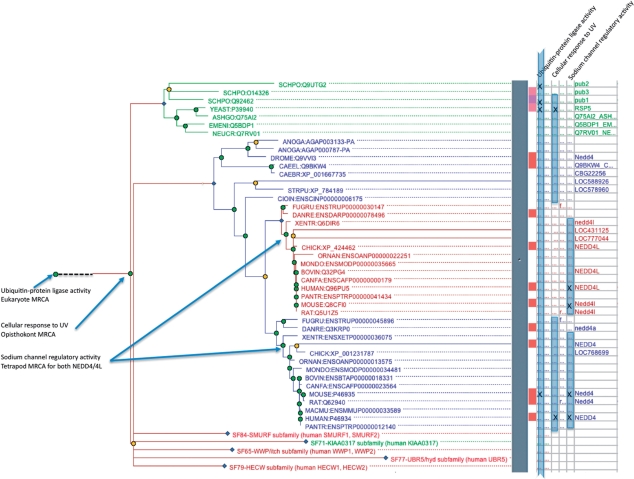
Protein Analysis THrough Evolutionary Relationships (PANTHER) is a comprehensive software system for inferring the functions of genes based on their evolutionary relationships. Phylogenetic trees of gene families form the basis for PANTHER and these trees are annotated with ontology terms describing the evolution of gene function from ancestral to modern day genes. One of the main applications of PANTHER is in accurate prediction of the functions of uncharacterized genes, based on their evolutionary relationships to genes with functions known from experiment. The PANTHER website, freely available at http://www.pantherdb.org, also includes software tools for analyzing genomic data relative to known and inferred gene functions. Since 2007, there have been several new developments to PANTHER: (i) improved phylogenetic trees, explicitly representing speciation and gene duplication events, (ii) identification of gene orthologs, including least diverged orthologs (best one-to-one pairs), (iii) coverage of more genomes (48 genomes, up to 87% of genes in each genome; see http://www.pantherdb.org/panther/summaryStats.jsp), (iv) improved support for alternative database identifiers for genes, proteins and microarray probes and (v) adoption of the SBGN standard for display of biological pathways. In addition, PANTHER trees are being annotated with gene function as part of the Gene Ontology Reference Genome project, resulting in an increasing number of curated functional annotations.


Figures

Figure 1.
Figure 1.
Distribution of protein family sizes in PANTHER version 7. (A) The distribution of the total number of genes (in all 48 genomes) per family. The N50 is about 150, i.e. about half the genes are in families larger than 150 members, and half are in smaller families. (B) The distribution of the total number of genomes per family. Most families contain genes from over 15 different species.
Figure 2.
Figure 2.
Example of human orthologs and LDO of the yeast RSP5 gene, identified using a phylogenetic tree. The figure shows part of the tree for PTHR11254 (HECT domain ubiquitin–protein ligase family), tracing the evolutionary relationship between RSP5 and its orthologs in humans, particularly its LDO, NEDD4. Orange nodes represent gene duplication events, green nodes represent speciation events, blue nodes represent subfamily nodes; in this figure blue nodes represent genes present in the bilaterian common ancestor that went on to found subfamilies. The solid outline ovals indicate the LDO pair in human and yeast, RSP5 and NEDD4 respectively. RSP5 has an additional nine orthologs in humans (dashed-outline ovals), but these have diverged to a greater degree than NEDD4. Conversely, 10 human genes have RSP5 as the ortholog, but only NEDD4 has RSP5 as the LDO. The LDO is identified by starting with the MRCA, and following the branch with the shortest length (least sequence divergence) after each gene duplication event. In this example, the MRCA is the speciation event that separated NEDD4 from RSP5 (labeled ‘1’), and there are at least two gene duplication events in the NEDD4 lineage: one at the base of the bilaterians representing multiple events that occurred in relatively rapid succession (labeled ‘2’) to create six genes in total and one at the base of the vertebrates (labeled ‘3’) to create the ancestors of NEDD4 and NEDD4L.
Figure 3.
Figure 3.
Annotating a PANTHER tree with GO terms, and inferring GO terms for other genes by homology. The tree is the same as in Figure 2. The ‘x’ marks in the adjoining table (right panel) show the experimental GO annotations for each gene in the tree. For instance, yeast RSP5 has been determined experimentally to have the function ‘ubiquitin–protein ligase activity’, and be involved in the process of ‘cellular response to UV’. Based on the distribution of experimental annotations among genes, and, in some cases, the target of protein activity, one can infer annotations of ancestral genes. For instance, yeast RSP5 and human NEDD4 have been experimentally determined to operate in ‘cellular response to UV’, through targeting of the RNAPII protein for degradation, so this function was likely present in their common ancestor and inherited by descent from this ancestor. PANTHER captures this ancestral gene annotation, as well as rules for inferring functions for experimentally unannotated genes (shown with blue bars). In this example, the ancestral gene annotation allows us to infer ‘cellular response to UV’ for all least-diverged orthologs of NEDD4/RSP5 in animals and fungi. Note that different function annotations are inferred to have arisen in different ancestral genes (annotated nodes at left); this results in different inferred annotations across the genes in the family (blue bars indicating gene annotations at right). For instance, all genes in the tree can be inferred to have ‘ubiquitin–protein ligase activity’, while only a few genes (tetrapod orthologs of human NEDD4 and NEDD4L) can be inferred to have ‘sodium channel regulatory activity’ (as their targets, specific epithelial sodium channel subunits, apparently evolved first in tetrapods, not shown).

Similar articles

Cited by

References

    1. Thomas PD, Campbell MJ, Kejariwal A, Mi H, Karlak B, Daverman R, Diemer K, Muruganujan A, Narechania A. PANTHER: a library of protein families and subfamilies indexed by function. Genome Res. 2003;13:2129–2141. - PMC - PubMed
    1. Hunter S, Apweiler R, Attwood TK, Bairoch A, Bateman A, Binns D, Bork P, Das U, Daugherty L, Duquenne L, et al. InterPro: the integrative protein signature database. Nucleic Acids Res. 2009;37:D211–D215. - PMC - PubMed
    1. Ashburner M, Ball CA, Blake JA, Botstein D, Butler H, Cherry JM, Davis AP, Dolinski K, Dwight SS, Eppig JT, et al. Gene ontology: tool for the unification of biology. The Gene Ontology Consortium. Nat. Genet. 2000;25:25–29. - PMC - PubMed
    1. The Gene Ontology Consortium. The Gene Ontology in 2010: extensions and refinements. Nucleic Acids Res. 2010;38:D331–D335. - PMC - PubMed
    1. Gaudet P, Chisholm R, Berardini T, Dimmer E, Engel S, Fey P, Hill D, Howe D, Hu J, Huntley R, et al. The Gene Ontology's; Reference Genome Project: a unified framework for functional annotation across species. PLoS Comput. Biol. 2009;5:e1000431. - PMC - PubMed

Publication types