. 2010 Mar;84(5):2270-81.
doi: 10.1128/JVI.02003-09. Epub 2009 Dec 16.

Inhibition of sterol biosynthesis reduces tombusvirus replication in yeast and plants

Affiliations

Inhibition of sterol biosynthesis reduces tombusvirus replication in yeast and plants

Monika Sharma et al. J Virol. 2010 Mar.

Abstract

The replication of plus-strand RNA viruses depends on subcellular membranes. Recent genome-wide screens have revealed that the sterol biosynthesis genes ERG25 and ERG4 affected the replication of Tomato bushy stunt virus (TBSV) in a yeast model host. To further our understanding of the role of sterols in TBSV replication, we demonstrate that the downregulation of ERG25 or the inhibition of the activity of Erg25p with an inhibitor (6-amino-2-n-pentylthiobenzothiazole; APB) leads to a 3- to 5-fold reduction in TBSV replication in yeast. In addition, the sterol biosynthesis inhibitor lovastatin reduced TBSV replication by 4-fold, confirming the importance of sterols in viral replication. We also show reduced stability for the p92(pol) viral replication protein as well as a decrease in the in vitro activity of the tombusvirus replicase when isolated from APB-treated yeast. Moreover, APB treatment inhibits TBSV RNA accumulation in plant protoplasts and in Nicotiana benthamiana leaves. The inhibitory effect of APB on TBSV replication can be complemented by exogenous stigmasterol, the main plant sterol, suggesting that sterols are required for TBSV replication. The silencing of SMO1 and SMO2 genes, which are orthologs of ERG25, in N. benthamiana reduced TBSV RNA accumulation but had a lesser inhibitory effect on the unrelated Tobacco mosaic virus, suggesting that various viruses show different levels of dependence on sterol biosynthesis for their replication.


Figures
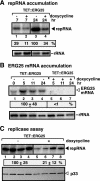
FIG. 1.
FIG. 1.
Downregulation of ERG25 expression reduces TBSV repRNA accumulation in yeast. (A) Northern blot analysis with a 3′-end-specific probe was used to detect the accumulation level of the TBSV repRNA. ERG25 expression was downregulated by doxycycline 12 h prior to expressing the TBSV-derived DI-72 repRNA in ERG25/THC yeast, which contains a doxycycline-regulatable promoter replacing the native ERG25 promoter. To launch TBSV repRNA replication, we expressed 6×His-p33 and 6×His-p92 from the ADH1 promoter and DI-72(+) repRNA from the galactose-inducible GAL1 promoter. After being pregrown in the presence of doxycycline, yeast cells were cultured for an additional 24 h at 29°C on 2% galactose SC minimal medium containing doxycycline (as indicated by a plus sign). The yeast was collected for total RNA extraction at the indicated time points. The accumulation levels of repRNA were calculated using Imagequant software. rRNA was used as a loading control (panel at the bottom). (B) Northern blot analysis to estimate the level of ERG25 mRNA in yeast grown in the absence or presence of doxycycline. (C) Decreased replicase activity in the presence of a low Erg25p level. Shown is a replicase activity assay with membrane-enriched preparations obtained from yeast expressing high or low levels of Erg25p, based on the addition of 10-mg/liter doxycycline to the growth medium 12 h prior to launching TBSV repRNA replication. The yeast samples were taken 24 h after the induction of TBSV replication. The membrane-enriched fraction contains the endogenous repRNA template that is used during the in vitro replicase assay in the presence of [32P]UTP and the other unlabeled ribonucleotide triphosphates. Note that the in vitro activities of the tombusviral replicase were normalized based on p33 levels.
FIG. 2.
FIG. 2.
Inhibition of TBSV repRNA accumulation in yeast treated with APB. (A) Yeast was treated with APB (0 to 60 μM, as shown), and TBSV repRNA replication was launched as described in the Fig. 1 legend. Samples for viral RNA analysis were taken at 24 h after the induction of TBSV replication. Northern blotting (top panel) shows the level of TBSV repRNA accumulation in individual samples using a 3′-end-specific probe. The middle panel shows a Northern blot indicating the level of 18S rRNA. Each experiment was repeated three times. Yeast treated with DMSO (the lanes marked by 0) was chosen as 100%. The bottom panel shows a Western blot for the 6×His-tagged p33 level in the samples. The graph shows the accumulation levels of DI-72(+) repRNA as percentages, which were normalized based on 18S rRNA levels. Note that the APB treatment at the highest concentration inhibited yeast growth, so we did not quantify TBSV repRNA accumulation for this treatment. (B) Northern blot showing the accumulation level of DI-72 repRNA in yeast lacking peroxisome (pex19Δ) and wild-type yeast (BY4741) treated with 30 μM APB or DMSO as shown. Note that the total RNA samples were loaded based on the adjusted 18S rRNA level. See further details in the legend to panel A. (C) Inhibitory effect of lovastatin treatment on TBSV repRNA accumulation. Lovastatin was used at a 20-μg/ml concentration. See further details in the legend to panel A.
FIG. 3.
FIG. 3.
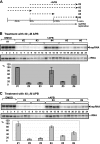
APB inhibits TBSV repRNA accumulation most effectively when applied at the beginning of virus replication in yeast. (A) The scheme of APB treatment relative to the initiation of repRNA replication. APB was added/removed to/from the growth medium as shown with dotted lines. repRNA replication took place for 24 h at 29°C before RNA analysis. Yeast was treated with 30 μM APB (B) or with 40 μM APB (C). Northern blotting (top panel) shows the level of TBSV repRNA accumulation. DMSO-treated yeast (lacking APB; lanes 1 to 4) was chosen as 100%. The graph shows the accumulation levels of DI-72(+) repRNA as percentages, which were normalized based on 18S rRNA levels. See other details in the legend to Fig. 1.
FIG. 4.
FIG. 4.
APB treatment of yeast inhibits the in vitro activity of the tombusvirus replicase and shortens the half-life of p92pol replication protein. (A) To launch TBSV repRNA replication, we expressed 6×His-p33 and 6×His-p92 from the CUP1 promoter and DI-72(+) repRNA from the TET promoter in the BY4741 yeast strain. Yeast cells treated with either 30 μM APB or DMSO were cultured for 24 h at 23°C on 2% glucose SC minimal medium containing 50 μM copper sulfate. (Top) The replicase activity in the membrane-enriched preparations obtained from yeast was measured in the presence of [32P]UTP and the other unlabeled ribonucleotide triphosphates. Note that the in vitro activities of the tombusviral replicase were not normalized to p33 levels in these experiments. (Middle) Western blot analysis to show p33/p92 levels in the above-described replicase preparations from APB- or DMSO-treated yeast. Note that the band migrating slightly faster than p92 is caused by heat- and SDS-resistant p33 homodimers. (Bottom) An ethidium bromide-stained gel showing the accumulation level of TBSV repRNA and rRNA in APB- or DMSO-treated yeast based on total RNA extracts. (B) Shortened half-life of p92pol due to APB treatment of yeast. Yeast was pregrown at 29°C for 12 h in SC L with 2% glucose and 30 μM APB or DMSO (0.03%), followed by the addition of 50 μM copper sulfate for 30 min to induce the expression of p92pol. After the removal of copper sulfate, 30 μM APB and cycloheximide (100 μg/ml) were added, and samples were collected at the shown time points. The amount of p92pol was estimated via Western blotting based on anti-His antibody and ECL-Plus. The images were analyzed by a phosphorimager and quantitated via Imagequant. The experiments were repeated three times. (C) Estimation of half-life of p33 after APB treatment of yeast. See details in the legend to panel B. (D) Lack of inhibition of in vitro translation of TBSV RNA by APB. The wheat germ translation assay was programmed with 0.3 μg artificial uncapped p92 or p33 mRNA carrying a poly(A) tail in the presence of 30 μM APB or DMSO as a control. The radiolabeled p92 and p33 products were analyzed on SDS-PAGE. The experiment was repeated three times.
FIG. 5.
FIG. 5.
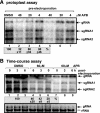
Inhibition of TBSV gRNA accumulation in N. benthamiana protoplasts by treatment with APB. (A) Northern blot analysis was used to detect the accumulation levels of TBSV gRNA and sgRNAs based on a 3′-end-specific probe. N. benthamiana protoplasts were treated with the shown concentrations of APB before electroporation. The samples were harvested 40 h after electroporation. The average values of sgRNA2 accumulation for the same treatments are shown under the image. (B) Time course assay to test the effectiveness of APB treatment. N. benthamiana protoplasts were treated with APB after electroporation (0, 3, or 6 h later). DMSO (0.06% solution), the solvent for APB, was used as a control. Northern blot analysis was done as described for panel A. The ethidium bromide-stained gel at the bottom shows the rRNA levels as loading controls. Note that the gRNA can reach rRNA levels in N. benthamiana protoplasts. The survival of the plant cells (after electroporation and treatment) was checked by measuring rRNA levels in total RNA extracts.
FIG. 6.
FIG. 6.
Complementation of the inhibitory effect of the APB treatment of N. benthamiana protoplasts on TBSV gRNA accumulation by phytosterols. (A) The stimulatory effect of stigmasterol on TBSV RNA accumulation. Northern blot analysis showing the accumulation levels of TBSV gRNA in N. benthamiana protoplasts treated with DMSO plus ethanol (lanes 1 to 4), APB alone (lanes 5 to 8), or with APB plus stigmasterol (lanes 9 to 12) before or after electroporation. The samples were harvested 40 h after electroporation. The ethidium bromide-stained gel in the bottom panel shows the rRNA levels as loading controls. (B) The stimulatory effect of campesterol on TBSV RNA accumulation. Northern blot analysis showing the accumulation levels of TBSV gRNA in N. benthamiana protoplasts treated with DMSO plus ethanol (lanes 1 to 4), APB alone (lanes 5 to 8), or with APB plus campesterol (lanes 9 to 12) before or after electroporation. See further details in the legend to panel A. Each experiment was repeated.
FIG. 7.
FIG. 7.
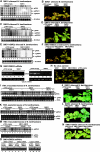
Inhibition of TBSV and CNV gRNA accumulation in N. benthamiana plants treated with APB. (A) Leaves first were infiltrated with DMSO (1.5%) or APB (1,500 μM), followed by the inoculation of the same leaves with TBSV virion preparation. Samples for viral RNA analysis were taken from the infiltrated leaves at 4 dpi. Northern blotting (top panel) shows the level of TBSV gRNA and sgRNA accumulation in individual samples using a 3′-end-specific probe. The bottom panel shows an ethidium bromide-stained gel indicating the levels of rRNA and TBSV gRNA. Each experiment was repeated three times. The DMSO sample was chosen as 100%. (B) The delay in symptom development due to TBSV infections in the APB-treated plant (shown on the right) at 6 dpi that indicates the potent antiviral activity of APB. Comparable DMSO treatment of plant leaves prior to inoculation with TBSV did not protect the plants from infection. (C) APB treatment inhibits CNV RNA accumulation in N. benthamiana plants. Treatment with DMSO or APB, inoculation of leaves with CNV, sample preparation, and Northern blotting were done as described in the legend to panel A for TBSV. (D) The delay in CNV-induced symptom development in the APB-treated plant at 10 dpi indicates the potent anti-CNV activity of APB. See further details in the legend to panel B. (E) Moderate inhibitory effect of APB treatment on TMV RNA accumulation in N. benthamiana plants. Treatment with DMSO or APB, inoculation of leaves with TMV, sample preparation, and Northern blotting with a TMV-specific probe were done as described in the legend to panel A. (D) The lack of delay in TMV-induced symptom development in the APB-treated plant at 10 dpi indicates the weak anti-TMV activity of APB. Plants mock inoculated and infiltrated with APB (1,500 μM) or DMSO (1.5%) are shown on the right. See further details in the legend to panel B.
FIG. 8.
FIG. 8.
Role of SMO1 and SMO2 sterol biosynthesis genes in TBSV RNA replication in whole plants. (A) Accumulation of TBSV gRNA in the inoculated leaves of SMO1 knockdown N. benthamiana plants 3 days postinoculation based on Northern blot analysis. VIGS was performed via the agroinfiltration of TRV vectors carrying SMO1 sequence or the TRV empty vector (as a control). Inoculation with TBSV gRNA was done 11 days after agroinfiltration. (B) Delay in TBSV-induced symptom development in the SMO1 knockdown plant (shown in the middle) at 10 dpi compared to the control plant infiltrated with pTRV empty vector (shown on the left) that indicates the requirement of SMO1 for TBSV infection. (C) Accumulation of TBSV gRNA in the inoculated leaves of SMO2 knockdown N. benthamiana plants 3 days postinoculation based on Northern blot analysis. See further details in the legend to panel A. (D) Delay in TBSV-induced symptom development in the SMO2 knockdown plant. See further details in the legend to panel B. (E) Accumulation of TBSV gRNA in the inoculated leaves of SMO1 and SMO2 knockdown N. benthamiana plants 3 days postinoculation based on Northern blot analysis. See further details in the legend to panel A. (F) Delay in TBSV-induced symptom development in the SMO1 and SMO2 knockdown plant. See further details in the legend to panel B. (G) Semiquantitative RT-PCR analysis of the accumulation of SMO1 or SMO2 mRNA in the knockdown N. benthamiana plants and in the control plants, which were agroinfiltrated with the TRV empty vector. Samples were taken 11 days after agroinfiltration. RT-PCR analysis of the tubulin mRNA from the same samples served as a control. (H) Minor phenotypic effect, such as moderately increased leaf size, of SMO1, SMO2, or both SMO1 and SMO2 knockdown on N. benthamiana plants compared to the phenotype of control plants, which were agroinfiltrated with the pTRV empty vector. (I) Accumulation of TMV sgRNA in the inoculated leaves of SMO1 or SMO2 knockdown N. benthamiana plants 3 days postinoculation based on Northern blot analysis (top image). The accumulation level of TMV gRNA and the rRNA (as a loading control) are shown in an ethidium bromide-stained gel (bottom image). See further details in the legend to panel A. (J) Lack of delay in TMV-induced symptom development in the SMO1 knockdown plant. See further details in the legend to panel B. (K) Accumulation of TMV sgRNA in the systemically infected leaves of SMO1 or SMO2 knockdown N. benthamiana plants 5 days postinoculation based on Northern blot analysis (top image). The accumulation level of TMV gRNA and the rRNA (as a loading control) are shown in an ethidium bromide-stained gel (bottom image). See further details in the legend to panel A. (L) Lack of delay in TMV-induced symptom development in the SMO2 knockdown plant. See further details in the legend to panel B. (M) Accumulation of TMV sgRNA in the inoculated leaves of SMO1 and SMO2 knockdown N. benthamiana plants 3 days postinoculation based on Northern blot analysis. See further details in the legend to panel I. (N) Lack of delay in TMV-induced symptom development in the SMO1 and SMO2 knockdown plant. See further details in the legend to panel J. (O) Semiquantitative RT-PCR analysis of the accumulation of SMO1 or SMO2 mRNA in the knockdown N. benthamiana plants and in the control plants, which were agroinfiltrated with the TRV empty vector. Samples were taken 11 days after agroinfiltration. The RT-PCR analysis of the tubulin mRNA from the same samples served as a control.

References

    1. Ahlquist, P., A. O. Noueiry, W. M. Lee, D. B. Kushner, and B. T. Dye. 2003. Host factors in positive-strand RNA virus genome replication. J. Virol. 77:8181-8186. - PMC - PubMed
    1. Aizaki, H., K. J. Lee, V. M. Sung, H. Ishiko, and M. M. Lai. 2004. Characterization of the hepatitis C virus RNA replication complex associated with lipid rafts. Virology 324:450-461. - PubMed
    1. Bard, M., D. A. Bruner, C. A. Pierson, N. D. Lees, B. Biermann, L. Frye, C. Koegel, and R. Barbuch. 1996. Cloning and characterization of ERG25, the Saccharomyces cerevisiae gene encoding C-4 sterol methyl oxidase. Proc. Natl. Acad. Sci. USA 93:186-190. - PMC - PubMed
    1. Bloch, K. 1992. Sterol molecule: structure, biosynthesis, and function. Steroids 57:378-383. - PubMed
    1. Bloch, K. E. 1983. Sterol structure and membrane function. CRC Crit. Rev. Biochem. 14:47-92. - PubMed

Publication types

MeSH terms

LinkOut - more resources