. 2010 Mar;84(5):2257-69.
doi: 10.1128/JVI.00584-09. Epub 2009 Dec 16.

Genomewide association analysis of respiratory syncytial virus infection in mice

Affiliations

Genomewide association analysis of respiratory syncytial virus infection in mice

James M Stark et al. J Virol. 2010 Mar.

Abstract

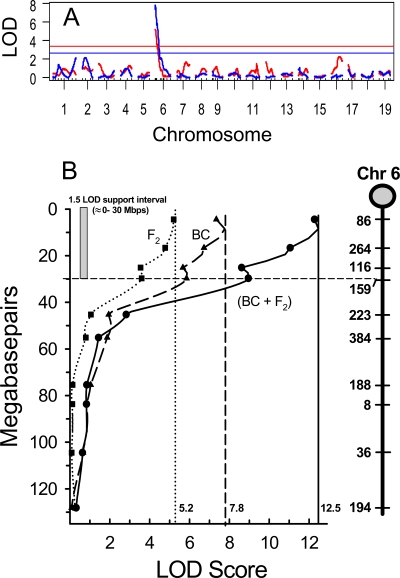
Respiratory syncytial virus (RSV) is the major cause of lower respiratory tract infection in infants, with about half being infected in their first year of life. Yet only 2 to 3% of infants are hospitalized for RSV infection, suggesting that individual susceptibility contributes to disease severity. Previously, we determined that AKR/J (susceptible) mice developed high lung RSV titers and showed delayed weight recovery, whereas C57BL/6J (resistant) mice demonstrated low lung RSV titers and rapid weight recovery. In addition, we have reported that gene-targeted mice lacking the cystic fibrosis transmembrane conductance regulator (Cftr; ATP-binding cassette subfamily C, member 7) are susceptible to RSV infection. For this report, recombinant backcross and F2 progeny derived from C57BL/6J and AKR/J mice were infected with RSV, their lung titers were measured, and quantitative trait locus (QTL) analysis was performed. A major QTL, designated Rsvs1, was identified on proximal mouse chromosome 6 in both recombinant populations. Microarray analysis comparing lung transcripts of the parental strains during infection identified several candidate genes that mapped to the Rsvs1 interval, including Cftr. These findings add to our understanding of individual RSV susceptibility and strongly support a modifier role for CFTR in RSV infection, a significant cause of respiratory morbidity in infants with cystic fibrosis.


Figures

FIG. 1.
FIG. 1.
(A) Genomewide LOD plot of total RSV lung titers at 4 days postinoculation. Linkage analyses were performed on the separate backcross (blue; n = 246) and F2 (red; n = 235) populations derived from sensitive (AKR/J) and resistant (C57BL/6J) strains. Analyses were performed with the R/QTL computer package (5). Significance thresholds were established by performing 10,000 permutations of each data set at 1-Mb steps and were plotted as F2 LOD scores of ≥3.4 and backcross LOD scores of ≥2.5. (B) Chromosome 6 LOD plots of the combined (•) and separate backcross (BC) (▴) and F2 (▪) populations for total RSV lung titers at 4 days postinoculation. Symbols represent corresponding mitochondrial microsatellite markers at Mbp positions (MGI map locations) along the chromosome (far right). The support interval is displayed along the y axis and represents the approximate Mbp span encompassing a bidirectional 1.5-LOD score drop from the QTL peak.
FIG. 2.
FIG. 2.
Pairwise analyses of gene interactions contributing to RSV resistance in the backcross and F2 progeny. Backcross (A) and F2 (B) populations were analyzed separately for all pairwise interactions. An analysis was performed for epistasis (top left half) and joint (additive plus epistatic) effects (bottom right half), using R/QTL. Significance thresholds are given on the colored bar to the right of each figure, with the scale on the left corresponding to epistasis LOD scores and the scale on the right showing joint LOD scores. (A) For the backcross progeny, no significant or suggestive epistatic (gene-gene) interactions were noted. A suggestive joint LOD score (additive effects) was detected between Rsvs1 on chromosome 6 and the suggestive QTL on chromosome 2 (joint LOD score = 10.6). (B) For the F2 population, the highest epistatic LOD score was 5.6, between Rsvs1 and D10Mit106. This pairwise LOD score fell short of the 5.9 threshold value for significance but was suggestive of an epistatic interaction. Combining this epistatic LOD score with the additive LOD score yielded a highly significant joint LOD score of 9.5, suggesting a positive interaction between the two markers/genes on chromosomes 6 and 10.
FIG. 3.
FIG. 3.
Group 1 genes cluster with a temporal pattern of increased levels at 12 to 48 h during RSV infection. (A) Group 1 consists of 96 elements clustering together on a self-organizing map of transcripts significantly (FDR < 0.05) altered in microarray analysis. (B) Comparison of mean tendencies of transcripts that increased in C57BL6/J and AKR/J mouse lungs. The responses of the mouse strains were comparable and increased nearly equally during infection. Values are presented as means ± standard errors of the means (SEM) for the 96 elements in group 1. (C) Representative transcripts increased in C57BL/6J and AKR/J mouse lungs during RSV infection. Activating kinases (Adar, Eif2aka), transcription factors (Stat1, Stat2, Irf7), and cytokines (Ccl2, Ccl4, Cxcl10) increased in both strains. (C) Representative transcripts increased in C57BL/6J and AKR/J mouse lungs during RSV infection and indicative of an interferon response. Antiviral proteins (Mx1, Mx2), oligoadenylate synthetases induced by IFN (Oas1a, Oasl1), and IFN-induced transcripts (Isg15, Ifit1, Tyki) increased in both strains. The results in panels C and D are mean ± SEM values obtained at 12 h postinoculation. Adar, adenosine deaminase, RNA-specific; Eif2ak2, eukaryotic translation initiation factor 2-alpha kinase 2; Stat1, signal transducer and activator of transcription 1; Stat2, signal transducer and activator of transcription 2; Irf7, interferon regulatory factor 7; Ccl2, chemokine (CC motif) ligand 2 (or MCP-1); Ccl4, chemokine (CC motif) ligand 4 (or MIP-1 beta); Cxcl10, chemokine (CXC motif) ligand 10 (or IP-10); Mx1, myxovirus (influenza virus) resistance 1; Mx2, myxovirus (influenza virus) resistance 2; Oas1a, 2′-5′ oligoadenylate synthetase 1A; Oasl1, 2′-5′ oligoadenylate synthetase-like 1; Isg15, ISG15 ubiquitin-like modifier; Ifit1, interferon-induced protein with tetratricopeptide repeats 1; Tyki, thymidylate kinase family LPS-inducible member.
FIG. 4.
FIG. 4.
Group 2 genes cluster with a temporal pattern of decreased levels at 6 h, more in AKR/J than in C57BL/6J mice, during RSV infection. (A) Group 2 consists of 18 elements that cluster together in the self-organizing map of transcripts significantly (FDR < 0.05) altered in microarray analysis. (B) Comparison of mean tendencies of transcripts that increased in C57BL6/J and AKR/J mouse lungs. The responses of the mouse strains were comparable, but AKR/J mice had a greater response at 6 h of infection. Values are presented as means ± SEM for the 18 elements in group 2. (C) Representative transcripts decreased more in AKR/J mouse lungs during RSV infection. Components of the troponin-actin complex (Tnnc2, Acta1, Tnnt3) and troponin-tropomyosin (Tpm2) and cytokeratin filaments (Krt1-13) decreased markedly in AKR/J mouse lungs. (D) Representative transcripts decreased in AKR/J lungs more than in C57BL/6J lungs during RSV infection and indicative of epithelial cytoskeletal involvement. Accompanying altered troponin-actin, myosin light and heavy chains (Myl1, Myh2) and muscle creatine kinase (Ckm) levels decreased in the mouse lung. In addition, components of the cornified epithelial cell envelope in terminally differentiated (Lor) and developing (Krt2-5) epidermal cells were decreased. Several gene products of this cluster have functional interactions with calcium (Clca3) and regulate cytoskeletal remodeling (Eef1a2). The results in panels C and D are mean ± SEM values obtained at 6 h postinoculation. Tnnc2, troponin C2, fast; Acta1, actin, alpha 1, skeletal muscle; Tnnt3, troponin T3, skeletal, fast; Tpm2, tropomyosin 2, beta; Tnni2, troponin I, skeletal, fast 2; Krt13, keratin 13; Myl1, myosin, light polypeptide 1; Myh2, myosin, heavy polypeptide 2, skeletal muscle, adult; Clca3, chloride channel calcium-activated 3 (or Gob5); Ckm, creatine kinase, muscle; Lor, loricrin; Krt5, keratin 5; Eef1a, eukaryotic translation elongation factor 1 alpha 2.
FIG. 5.
FIG. 5.
Group 3 genes cluster with a temporal pattern of increased levels at 48 h, more in C57BL/6J than in AKR/J mouse lungs, during RSV infection. (A) Group 3 consists of 68 elements that cluster together in the self-organizing map of transcripts significantly (FDR < 0.05) altered in microarray analysis. (B) Comparison of mean tendencies of transcripts that increased in C57BL/6J and AKR/J mouse lungs. The responses of the C57BL/6J mice were greater than those of the AKR/J mouse strain at 48 h of infection. Values are presented as means ± SEM for the 68 elements in group 3. (C) Representative transcripts increased more in C57BL/6J mouse lungs during RSV infection and indicative of enhanced T-cell involvement. Increases in surface CD antigens that characterize T cells (Cd3d, Cd4, Cd8a, Cd247), T-cell receptors (Tcrb-V8.2, Tcra), and cytokine signal transduction molecules (Itk, Ikzf1) are supportive of a marked influx of T cells into the lungs of C57BL/6J mice, which exceeded that of AKR/J mice. (D) Representative transcripts increased more in C57BL/6J than in AKR/J mouse lungs during RSV infection and indicative of T-cell and nucleosome involvement. Supportive of the aforementioned T-cell signaling molecules, antigen receptor-activated (Ptprc), transcription factor (Vav1), cytokinesis (Dock2), and ancillary (Coro1a; Arhgdib) transcripts increased more in C57BL/6J mouse lungs. Transcripts for a number of histones (18 transcripts were found in this group, including Hist1h3b) contribute to altered nucleosome assembly. The results in panels C and D are mean ± SEM values obtained at 48 h postinoculation. Tcrb-V8.2, T-cell receptor beta, variable 8.2; Cd8a, CD8 antigen, alpha chain; Cd3d, CD3 antigen, delta polypeptide; Cd247, CD247 antigen; Tcra, T-cell receptor alpha chain; Itk, IL-2-inducible T-cell kinase; Cd4, CD4 antigen; Ikzf1, IKAROS family zinc finger 1; Hist1h3b, histone cluster 1, H3b; Pvrl1, poliovirus receptor-related 1; Ptprc, protein tyrosine phosphatase, receptor type, C; Coro1a, coronin, actin binding protein 1A; Vav1, vav 1 oncogene; Arhgdib, Rho, GDP dissociation inhibitor (GDI) beta; Dock2, dedicator of cytokinesis 2.
FIG. 6.
FIG. 6.
Group 4 genes cluster with a temporal pattern of increased levels at 192 h, more in C57BL/6J than in AKR/J mouse lungs, during RSV infection. (A) Group 4 consists of 17 elements that clustered in 3 regions in the self-organizing map of transcripts significantly (FDR < 0.05) altered in microarray analysis. (B) Comparison of mean tendencies of transcripts that increased in C57BL6/J and AKR/J mouse lungs. The responses of the C57BL/6J mice were greater than those of the AKR/J mouse strain 192 h after inoculation. Values are presented as means ± SEM for the 17 elements in group 4. (C) Representative transcripts increased more in C57BL/6J mouse lungs during RSV infection and indicative of enhanced T-cell involvement. Increases in cytokines (Retnla, Cxcl9, Ccl8, Cxcr6, Ccl5) and complement components (C1qg) are consistent with the development of determinants of immunogenicity and tolerance in the lungs of C57BL/6J mice, which exceeded that in AKR/J mice. (D) Representative transcripts increased more in C57BL/6J than in AKR/J mouse lungs following RSV infection and indicative of epithelial cell involvement. Increased epithelial (Clca3, Reg3g, Muc5b, Tff2) and macrophage chitinase (Chi3l4) transcripts are consistent with airway and alveolar remodeling as a sequela to infection. The results in panels C and D are mean ± SEM values obtained at 192 h postinoculation. Retnla, resistin-like alpha (or Fizz1 [found in inflammatory zone 1] or HIMF [hypoxia-induced mitogenic factor]); Cxcl9, chemokine (CXC motif) ligand 9 (or Mig [monokine induced by gamma interferon]); Ccl8, chemokine (CC motif) ligand 8 (or Mcp-2 [monocyte chemoattractant protein 2]); Cxcr6, chemokine (CXC motif) receptor 6; Ccl5, chemokine (CC motif) ligand 5 (or RANTES [regulated upon activation, normally T-expressed, and presumably secreted]); C1qg, complement component 1, q subcomponent, gamma polypeptide; Clca3, chloride channel calcium-activated 3 (or Gob5); Reg3g, regenerating islet-derived 3 gamma; Chi3l4, chitinase 3-like 4; Muc5b, mucin 5, subtype B, tracheobronchial; Tff2, trefoil factor 2 (spasmolytic protein 1).

Similar articles

Cited by

References

    1. Abman, S. H., J. W. Ogle, N. Butler-Simon, C. M. Rumack, and F. J. Accurso. 1988. Role of respiratory syncytial virus in early hospitalizations for respiratory distress of young infants with cystic fibrosis. J. Pediatr. 113:826-830. - PubMed
    1. Armstrong, D., K. Grimwood, J. B. Carlin, R. Carzino, J. Hull, A. Olinsky, and P. D. Phelan. 1998. Severe viral respiratory infections in infants with cystic fibrosis. Pediatr. Pulmonol. 26:371-379. - PubMed
    1. Benjamini, Y., and Y. Hochberg. 1995. Controlling the false discovery rate: a practical and powerful approach to multiple testing. J. R. Stat. Soc. B 57:289-300.
    1. Boyce, T. G., B. G. Mellen, E. F. Mitchel, Jr., P. F. Wright, and M. R. Griffin. 2000. Rates of hospitalization for respiratory syncytial virus infection among children in Medicaid. J. Pediatr. 137:865-870. - PubMed
    1. Broman, K. W., H. Wu, S. Sen, and G. A. Churchill. 2003. R/qtl: QTL mapping in experimental crosses. Bioinformatics 19:889-890. - PubMed

Publication types

MeSH terms

Substances