Comparative Study
. 2009 Dec 16;29(50):15621-9.
doi: 10.1523/JNEUROSCI.4465-09.2009.

Selection and maintenance of spatial information by frontal eye field neurons

Affiliations
Comparative Study

Selection and maintenance of spatial information by frontal eye field neurons

Katherine M Armstrong et al. J Neurosci. .

Abstract

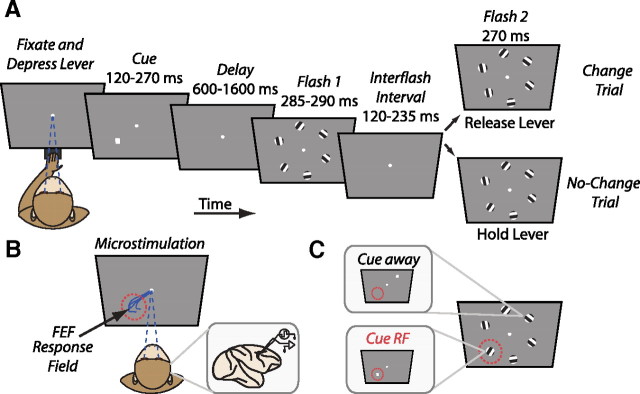
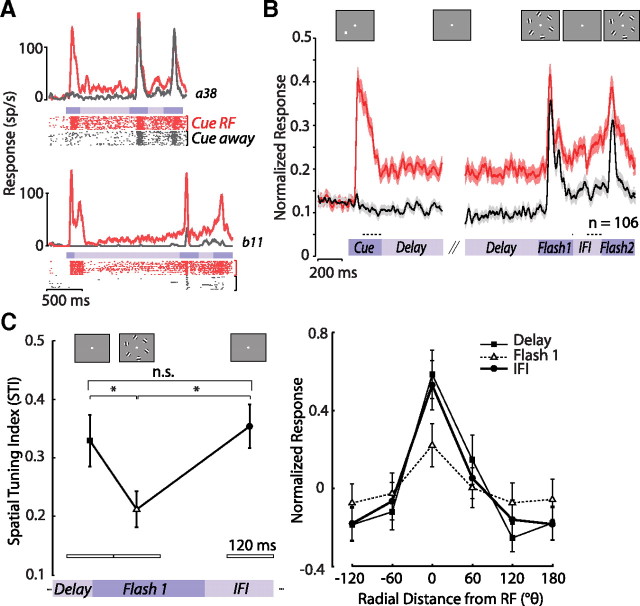
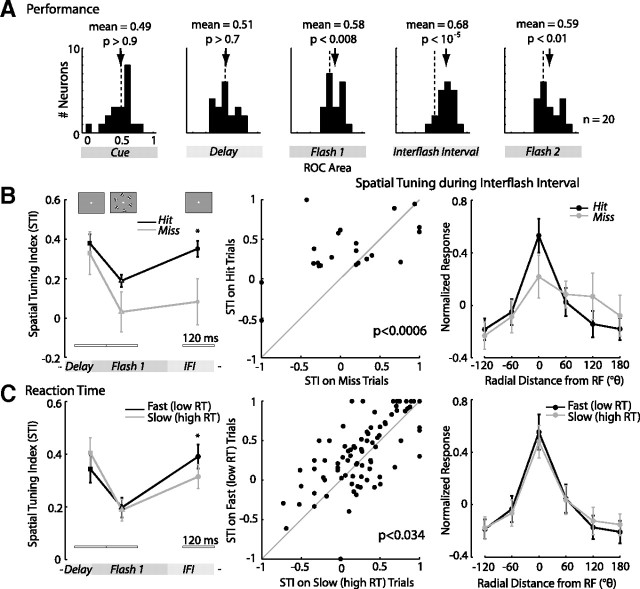
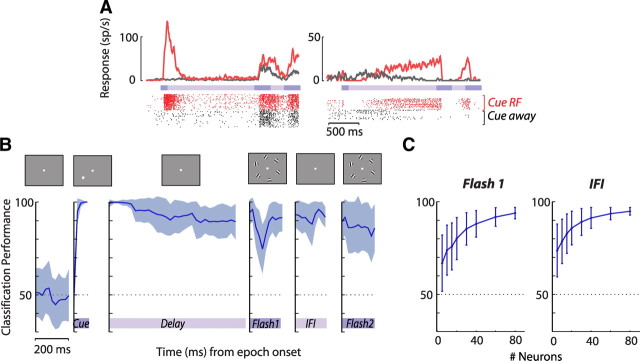
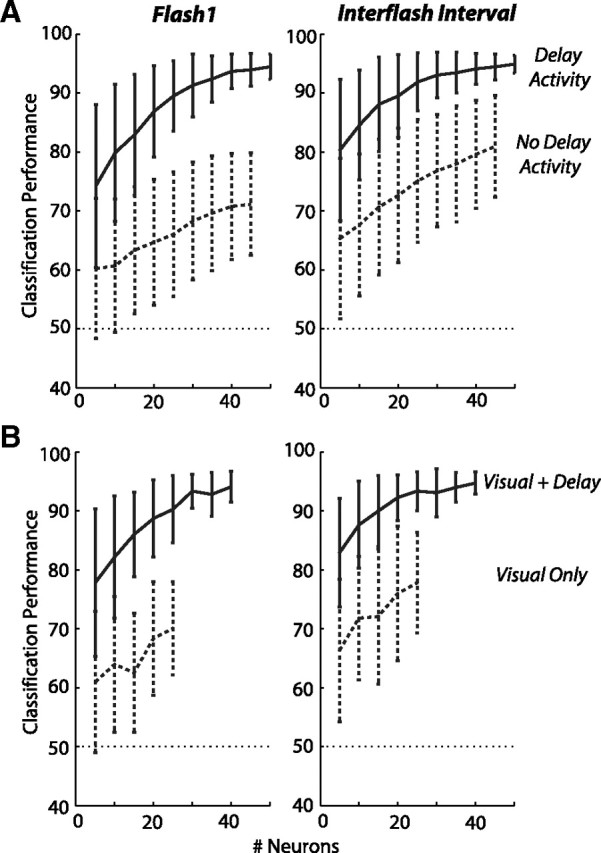
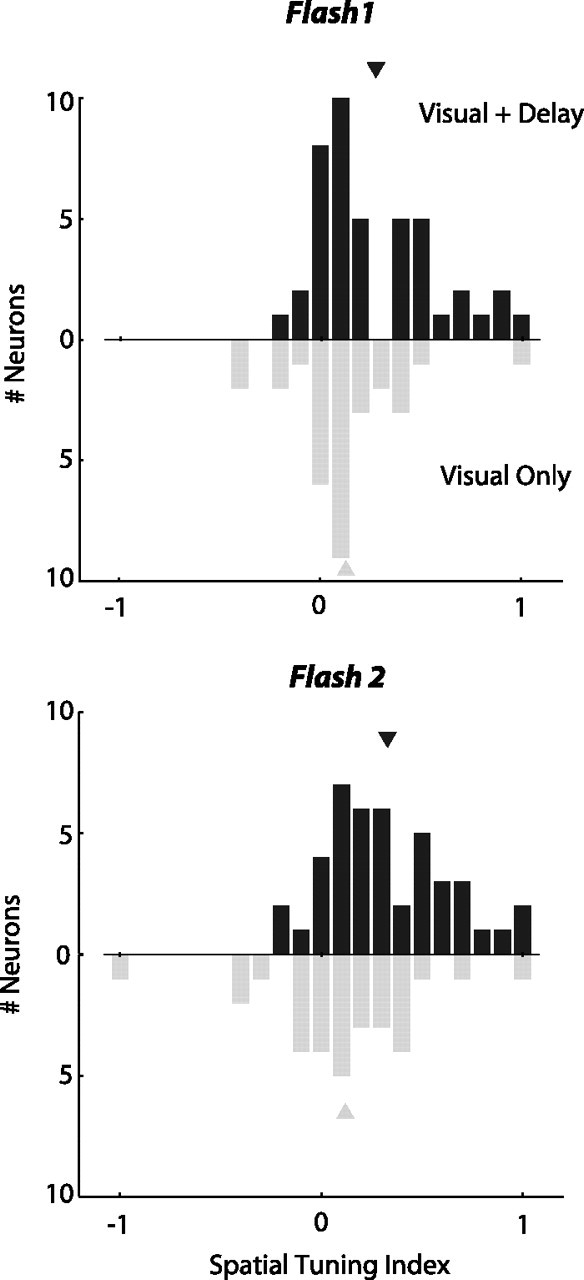
Voluntary attention is often allocated according to internally maintained goals. Recent evidence indicates that the frontal eye field (FEF) participates in the deployment of spatial attention, even in the absence of saccadic eye movements. In addition, many FEF neurons maintain persistent representations of impending saccades. However, the role of persistent activity in the general maintenance of spatial information, and its relationship to spatial attention, has not been explored. We recorded the responses of single FEF neurons in monkeys trained to remember cued locations in order to detect changes in targets embedded among distracters in a task that did not involve saccades. We found that FEF neurons persistently encoded the cued location throughout the trial during the delay period, when no visual stimuli were present, and during visual discrimination. Furthermore, FEF activity reliably predicted whether monkeys would detect the target change. Population analyses revealed that FEF neurons with persistent activity were more effective at selecting the target from among distracters than neurons lacking persistent activity. These results demonstrate that FEF neurons maintain spatial information in the absence of saccade preparation and suggest that this maintenance contributes to the selection of relevant visual stimuli.


Figures

Figure 1.
Figure 1.
Experimental setup. A, Change detection task. The monkey maintained fixation throughout the duration of the trial. To initiate a trial, the monkey depressed a manual lever, and, after a few hundred milliseconds, a peripheral cue was presented briefly, indicating the target location. After a fixed delay period, an array of six oriented gratings was flashed twice. On trials in which the target stimulus changed orientation across flashes (change trial), the monkey was rewarded for releasing the lever. On trials in which the target stimulus did not change (no-change trial), the monkey was rewarded for continuing to hold the lever for an additional 600–1000 ms. All six locations were equally likely to be cued, and the cue was 100% valid. B, Stimulus alignment. The FEF RF for each recording site was determined before running the change detection task by applying microstimulation (<50 μA) during a simple fixation task and mapping the evoked saccades. An example set of eye traces from microstimulation-evoked saccades are shown. The array of gratings was positioned such that one grating was centered at the average evoked saccade endpoint. C, Trials in which the monkey was cued to attend to the response field are labeled “Cue RF,” whereas trials in which the monkey was cued to attend to the opposite array location are labeled “Cue away.”
Figure 2.
Figure 2.
Example and population responses of FEF neurons during the change detection task. A, The spike activity of an example neuron from each monkey during the task. Histograms show the average response of each neuron on correct trials in which the monkey was cued to attend to the RF location (red) and cued to attend away (gray). Rasters show action potentials recorded on individual trials. B, The average normalized response of 106 FEF neurons aligned to the onset of the cue (left) and the onset of the first presentation of the stimulus array (right). Only no-change trials are included in the right. Panels along the top show a schematic diagram of the display seen by the monkey during each task epoch. Conventions for the histogram are the same as in A, with shading indicating SEM response. Dots above each epoch label indicate variable timing across experiments. C, Spatial tuning across task epochs. Left, The average STI during each of three task epochs: delay period, flash 1, and interflash interval. For each neuron, an STI was calculated using the average firing rate in cue RF and cue away conditions during three 120 ms analysis windows aligned to the delay period, flash 1, and interflash interval epochs as shown. Panels along the top show a schematic diagram of the display seen by the monkey. Right, Average normalized spatial tuning curves during the three epochs in the left plot as a function of radial distance from the RF location. For each neuron and epoch, the responses across all six array locations were converted to z-scores. Error bars indicate SEM. IFI, Interflash interval. Asterisks denote differences between epochs, p < 0.05.
Figure 3.
Figure 3.
FEF responses and task performance. A, To examine the relationship between FEF responses and change detection performance, ROC areas were computed from the response of each neuron on hit and miss trials. Distributions of ROC areas for neurons with at least five miss trials in the cue RF condition (n = 20) during each trial epoch. The dotted lines mark an ROC area of 0.5, and the arrows indicate the means of the distributions. B, Spatial tuning and change detection performance. Left, Average spatial tuning index for hit trials, in which the monkey correctly responded to the target change (black), and miss trials, in which the monkey did not respond to the target change (gray) during the delay period, flash 1, and interflash interval epochs. Conventions are the same as in Figure 2C. Middle, Scatter plot of spatial tuning indices during the 120 ms interflash interval analysis window on hit trials versus miss trials. The diagonal line of unity is included for reference. Right, Average normalized spatial tuning curve during the interflash interval for hit (black) and miss (gray) trials as a function of radial distance from the response field location. Conventions are the same as in Figure 2C. Asterisks denote differences between hit and miss trials, p < 0.05. C, Spatial tuning and manual reaction time on hit trials. Left, Spatial tuning index for fast (low reaction time) trials (black) and slow (high reaction time) trials (gray) across three trial epochs. Middle, Scatter plot of spatial tuning indices during the interflash interval on fast reaction time trials versus slow reaction time trials. Right, Average normalized spatial tuning curve during the interflash interval for fast reaction time (black) and slow reaction time (gray) trials. Asterisks denote differences between fast and slow RT trials, p < 0.05.
Figure 4.
Figure 4.
Decoding cue location from a heterogeneous population of FEF neurons. A, Heterogeneity of neuronal responses. The spike activity of two example neurons from one monkey, using the same conventions as Figure 2A. Left, A visually responsive neuron. Right, A visually suppressed neuron that showed spatial selectivity during the delay period. B, Time course of the average classification performance of 50 support vector machines, each trained on spike activity during cue RF and cue away trials in sliding 50 ms windows from a random subset of 40 FEF neurons, sampled with replacement. Data are aligned to the beginning of each task epoch, with panels along the top showing a schematic diagram of the display seen by the monkey during each epoch. Shading indicates SD, and the dotted line indicates chance performance. C, Average classification performance as a function of neuron population size during the flash 1 and interflash interval epochs. Analysis windows used are the same as in Figures 2 and 3. Error bars indicate SD, and the dotted line indicates chance performance. IFI, Interflash interval.
Figure 5.
Figure 5.
Cue location classification performance varies for different subgroups of FEF neurons. Average classification performance shown as a function of neuron population size during the flash 1 and interflash interval epochs. A, Solid lines show the average performance of 500 classifiers trained and tested on the responses of FEF neurons that had persistent spatial activity during the delay period (“Delay Activity”). Dashed lines show the average performance of classifiers trained on the responses of neurons that lacked persistent delay period activity (“No Delay Activity”). Analysis windows used are the same as in Figures 2–4. Error bars indicate SD, and the thin dotted line indicates chance performance. B, Solid lines show the average performance of 500 classifiers trained and tested on the responses of FEF neurons that were visually responsive and had persistent spatial activity during the delay period (“Visual + Delay”). Dashed lines show the average performance of classifiers trained on the responses of visually responsive neurons that lacked persistent delay period activity (“Visual Only”).
Figure 6.
Figure 6.
Spatial tuning during visual discrimination varies for different subgroups of FEF neurons. STIs were computed for each neuron by taking the difference of the average visual response to the flashed stimulus array during the cue RF and cue away conditions and dividing by the sum of the two responses. Dark and light gray histograms show the distribution of STIs during the flash 1 (top) and flash 2 (bottom) epochs for “Visual + Delay” and “Visual Only” neurons, respectively. Triangles indicate the means of the distributions.

Similar articles

Cited by

References

    1. Abbott LF, Dayan P. The effect of correlated variability on the accuracy of a population code. Neural Comput. 1999;11:91–101. - PubMed
    1. Armstrong KM, Moore T. Rapid enhancement of visual cortical response discriminability by microstimulation of the frontal eye field. Proc Natl Acad Sci U S A. 2007;104:9499–9504. - PMC - PubMed
    1. Armstrong KM, Fitzgerald JK, Moore T. Changes in visual receptive fields with microstimulation of frontal cortex. Neuron. 2006;50:791–798. - PubMed
    1. Awh E, Anllo-Vento L, Hillyard SA. The role of spatial selective attention in working memory for locations: evidence from event-related potentials. J Cogn Neurosci. 2000;12:840–847. - PubMed
    1. Awh E, Armstrong KM, Moore T. Visual and oculomotor selection: links, causes and implications for spatial attention. Trends Cogn Sci. 2006;10:124–130. - PubMed

Publication types

LinkOut - more resources