Comparative Study
. 2009 Dec 16;29(50):15642-9.
doi: 10.1523/JNEUROSCI.5096-09.2009.

Netrin-1-dependent spinal interneuron subtypes are required for the formation of left-right alternating locomotor circuitry

Affiliations
Comparative Study

Netrin-1-dependent spinal interneuron subtypes are required for the formation of left-right alternating locomotor circuitry

Nadine Rabe et al. J Neurosci. .

Abstract

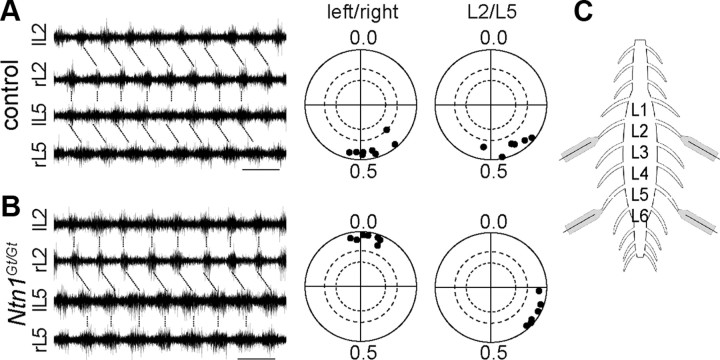
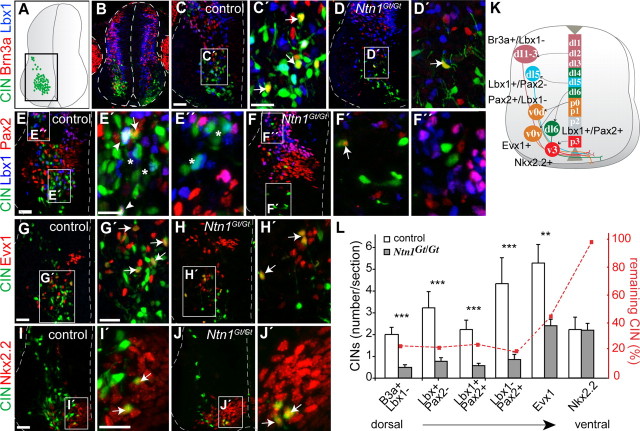
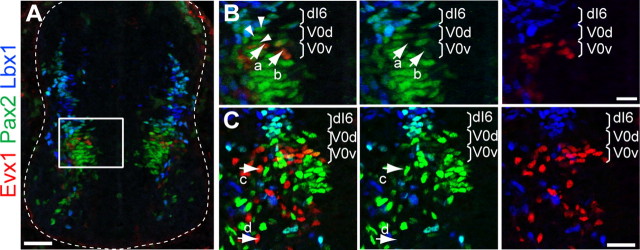
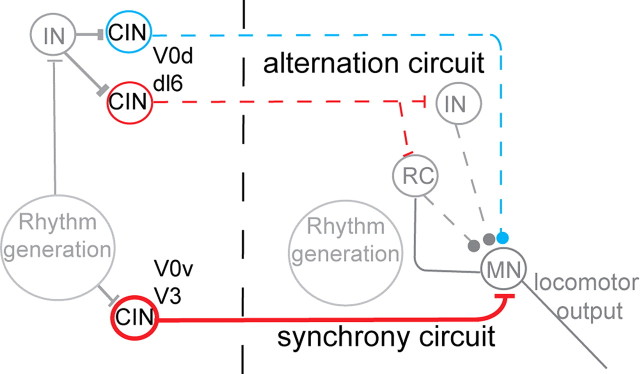
Neuronal circuits in the spinal cord that produce the rhythmic and coordinated activities necessary for limb movements are referred to as locomotor central pattern generators (CPGs). The identities and preceding development of neurons essential for coordination between left and right limbs are not yet known. We show that the ventral floor plate chemoattractant Netrin-1 preferentially guides dorsally originating subtypes of commissural interneurons, the majority of which are inhibitory. In contrast, the excitatory and ventralmost V3 subtype of interneurons have a normal number of commissural fibers in Netrin-1 mutant mice, thus being entirely independent of Netrin-1-mediated attraction. This selective loss of commissural fibers in Netrin-1 mutant mice resulted in an abnormal circuitry manifested by a complete switch from alternating to synchronous fictive locomotor activity suggesting that the most ventral-originating excitatory commissural interneurons are an important component of a left-right synchrony circuit in the locomotor CPG. Thus, during development, Netrin-1 plays a critical role for the establishment of a functional balanced CPG.


Figures

Figure 1.
Figure 1.
Severe loss of traced commissural interneurons in E12.5 Ntn1Gt/Gt embryos. A–D, Overview of CINs of tracings in E12.5 mouse embryos. Tracer was applied in situ in free dissected spinal cords remaining in the embryo (A, B). In enlarged photomicrograph (C), tracer application sites are indicated with asterisks and the midline is outlined with a white dashed line. White arrows point at traced contralateral interneurons. In the schematic drawing (D), the spinal cord is outlined with the area of analysis (aa) indicated with a bracket where sections (E, F) were collected (T12, thoracic level 12; L5, lumbar level 5). E, F, Photomicrographs showing intersegmental FDA traced CINs, from control (E) and Ntn1Gt/Gt mice (F) taken from transverse spinal cord section as indicated in the inset. White dashed line outlines the spinal cord and the white box represents area of higher-magnification picture. Scale bar 30 μm.
Figure 2.
Figure 2.
Loss of commissural interneurons in newborn Ntn1Gt/Gt mice. A, Overview of intrasegmental and intersegmental tracings of CINs in P0 mice. B–G, Photomicrographs of transverse sections of the spinal cord L2 segment from control and Ntn1Gt/Gt mice. Low power (B–E) and higher magnification (F, G). Scale bars 200 μm. H, Quantification of aCINs (green), dCINs (red) and adCINs (yellow). Values are given as means ± SEM, count on 5 consecutive sections for n = 6 animals for each group, ***p < 0.0001. The number of commissural neurons is dramatically reduced in P0 Ntn1Gt/Gt mice. White boxes indicate areas of higher magnification. Error bars indicate SEM.
Figure 3.
Figure 3.
Ntn1Gt/Gt mice display synchronous left-right coordination in fictive locomotion. A, B, Recorded activity in ventral roots of left (l) and right (r) lumbar segment (L)2 and L5 from P0 spinal cords of control mice (A) and Ntn1Gt/Gt mice (B). Control mice displayed normal left-right alternation (n = 10) whereas Ntn1Gt/Gt mice displayed left-right synchrony (n = 7). Circular phase diagrams of intersegmental L2/L5 coordination show alternation in both control (n = 8) and Ntn1Gt/Gt (n = 6) mice. Scale bar 5 s. Each dot represent the mean phase of one animal and stippled circle indicate significant (inner) or highly significant (outer) values. C, Schematic illustration of ventral root recording set-up to measure fictive locomotion.
Figure 4.
Figure 4.
Remaining commissural interneurons in Ntn1Gt/Gt mice are predominantly excitatory. A–D, Photomicrographs of in situ staining for Vglut2 or VIAAT mRNA on FDA traced spinal cord sections. Arrowheads show CINs positive for Vglut2 or VIAAT respectively, while arrows indicate single labeled CINs. Scale bar 25 μm. E, Quantification of the neurotransmitter used by traced CINs on lumbar spinal cord sections from control or Ntn1Gt/Gt mice, counted on 6–10 consecutive sections and n = 3 animals for each group. F, Schematic drawing illustrating glutamatergic (red) or glycinergic/GABAergic (blue) neurotransmitter phenotype of commissural neurons in control and Ntn1Gt/Gt mice. G, The ratio of excitatory versus inhibitory CINs for control, Ntn1Gt/Gt mice from data presented in (E) showing a shift toward more Vglut2-positive CINs in Ntn1Gt/Gt mice. Values are given as means ± SEM, ***p < 0.001. H, Circular phase diagrams of analyzed fictive locomotion experiments performed on spinal cords from Ntn1Gt/Gt mice before and after treatment with 100 μm sarcosine. The arrows represent the grand mean of all animals in each condition. Only animals that subsequently were treated are included in the diagrams (n = 4). Sarcosine treatments left the synchronous left-right coordination unchanged in the Ntn1Gt/Gt mice.
Figure 5.
Figure 5.
Loss of Netrin-1 has a more severe effect on dorsal compared with ventral originating CIN subpopulations. A, B, Schematic representation of the E12.5 neuronal tube and the position of traced CINs according to the transverse immunostained section of an FDA-traced control embryo shown in B. C–J, Photomicrographs of control and Ntn1Gt/Gt animals showing the region of traced CINs according to the black box in A and staining for transcription factors as indicated to the left. White boxes in C–J indicate areas of higher magnification in respective panel to the right (C′–J′). C, D, G–J, Arrows point to Brn3a+/Lbx1 (C′, D′), Evx1+ (G′, H′), Nkx2.2+ (I′, J′), CINs. E, F, Pax2+/Lbx1 (arrows) and Lbx1+/Pax2+ (arrowheads) CINs are found within the ventral group of traced neurons (E′) while the majority of Lbx1+/Pax2 CINs (stars) are more dorsally located (E″). Scale bars, 30 μm. K, Schematic drawing of progenitor domains and early neuronal domains labeled by the transcription factors used in this study. L, Quantification of transcription factor phenotype in traced CINs shows significant differences in affected CIN populations in Ntn1Gt/Gt mice. CIN remaining in Ntn1Gt/Gt animals colabel predominantly with Evx1 and Nkx2.2. Error bars indicate SEM n = 5 for control and n = 6 for Ntn1Gt/Gt embryos for all markers analyzed. For Brn3a/Lbx1 measurements in control embryos; T (total count traced neurons) = 724, s (sections) = 19; for Ntn1Gt/Gt embryos: T = 460, s = 39; ***p < 0.0001. Lbx1/Pax2 measurements in control embryos; T = 555, s = 15; for Ntn1Gt/Gt embryos: T = 533, s = 46; p < 0.0001. Evx1 measurements in control embryos: T = 541, s = 18; Ntn1Gt/Gt embryos: T = 569, s = 50; **p = 0.0033. Nkx2.2 in control embryos: T = 332, s = 11; Ntn1Gt/Gt embryos: T = 586, s = 51; p = 0.9731.
Figure 6.
Figure 6.
V0d neurons express Pax2. A–C, Photomicrographs of immunohistochemistry experiments using antibodies against indicated transcription factors on E11.5 (A, B) or E12.5 (C) spinal cord transverse sections. White box in A indicates areas of higher magnification in B panels. Arrowheads indicate Pax2+ cells and arrows indicate Evx1+ (V0v) cells. At E11.5, cells in the ventral V0 domain express Pax2 at clearly distinguishable levels whereas cells in the dorsal V0 domain express low or no Pax2 (see arrows a and b). Lbx1, expressed in dI4 to dI6 subpopulations (Gross et al., 2002), is here used to delineate the border between the dI6 and V0 subpopulations. C, One day later, a similar situation is observed; V0v neurons, as labeled by Evx1 (arrows c and d), express lower or no levels of Pax2 protein while V0d neurons express high levels of Pax2. Scale bars: A, 100 μm, B, C, 30 μm.
Figure 7.
Figure 7.
Schematic model of the CPG components responsible for left-right coordination in the Netrin-1 mutant spinal cord (adapted from Crone et al., 2008). Due to the loss of commissural interneurons from distinct progenitor domains in netrin-1 mutant mice, the left-right alternation circuit is weakened as indicated by stippled lines, compared with the left-right synchrony circuit (solid line). This reduction of CINs results in a loss of more inhibitory (blue) than excitatory (red) fibers over the midline, which is a likely explanation for the left-right synchrony observed in fictive locomotion of Netrin-1 mutant mice. The model also includes possible subpopulation identities of ventral and dorsal derived commissural interneurons within the spinal locomotor network, based on the present findings and prior work (Lanuza et al., 2004; Zhang et al., 2008).

Similar articles

Cited by

References

    1. Avraham O, Hadas Y, Vald L, Zisman S, Schejter A, Visel A, Klar A. Transcriptional control of axonal guidance and sorting in dorsal interneurons by the Lim-HD proteins Lhx9 and Lhx1. Neural Dev. 2009;4:21. - PMC - PubMed
    1. Beg AA, Sommer JE, Martin JH, Scheiffele P. alpha2-Chimaerin is an essential EphA4 effector in the assembly of neuronal locomotor circuits. Neuron. 2007;55:768–778. - PubMed
    1. Bermingham NA, Hassan BA, Wang VY, Fernandez M, Banfi S, Bellen HJ, Fritzsch B, Zoghbi HY. Proprioceptor pathway development is dependent on Math1. Neuron. 2001;30:411–422. - PubMed
    1. Branchereau P, Morin D, Bonnot A, Ballion B, Chapron J, Viala D. Development of lumbar rhythmic networks: from embryonic to neonate locomotor-like patterns in the mouse. Brain Res Bull. 2000;53:711–718. - PubMed
    1. Briscoe J, Sussel L, Serup P, Hartigan-O'Connor D, Jessell TM, Rubenstein JL, Ericson J. Homeobox gene Nkx2.2 and specification of neuronal identity by graded Sonic hedgehog signalling. Nature. 1999;398:622–627. - PubMed

Publication types

LinkOut - more resources