

Orientation discrimination performance is predicted by GABA concentration and gamma oscillation frequency in human primary visual cortex
- PMID: 20016087
- PMCID: PMC6666191
- DOI: 10.1523/JNEUROSCI.4426-09.2009
Orientation discrimination performance is predicted by GABA concentration and gamma oscillation frequency in human primary visual cortex
Abstract
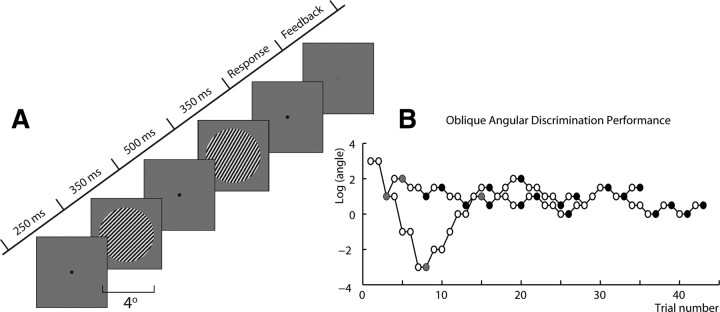
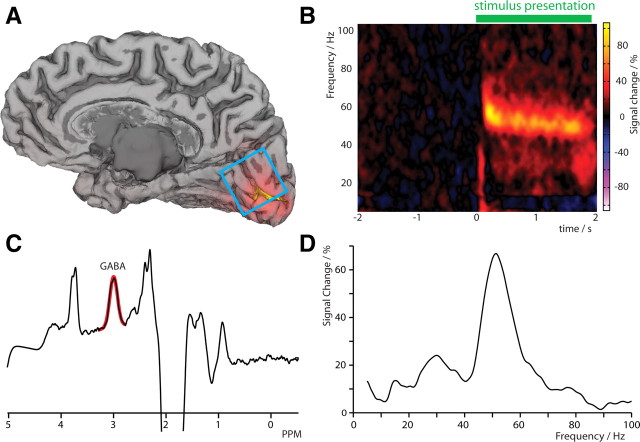
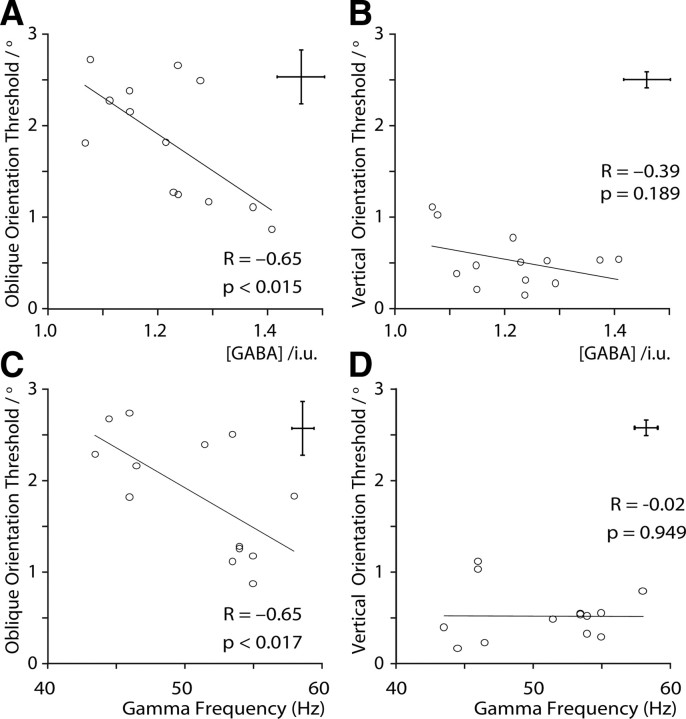
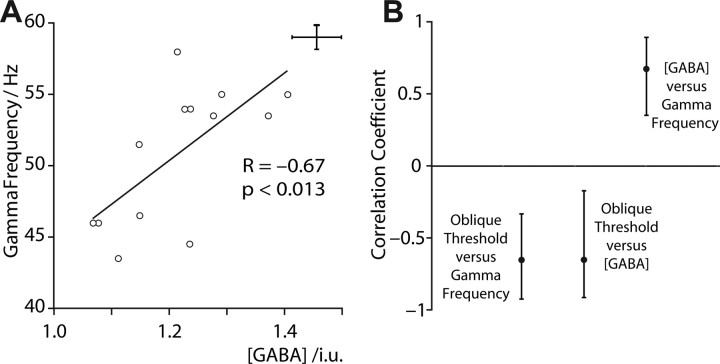
Neuronal orientation selectivity has been shown in animal models to require corticocortical network cooperation and to be dependent on the presence of GABAergic inhibition. However, it is not known whether variability in these fundamental neurophysiological parameters leads to variability in behavioral performance. Here, using a combination of magnetic resonance spectroscopy, magnetoencephalography, and visual psychophysics, we show that individual performance on a visual orientation discrimination task is correlated with both the resting concentration of GABA and the frequency of stimulus-induced gamma oscillations in human visual cortex. Behaviorally, a strong oblique effect was found, with the mean angular threshold for oblique discrimination being five times higher than that for vertically oriented stimuli. Similarly, we found an oblique effect for the dependency of performance on neurophysiological parameters. Orientation detection thresholds were significantly negatively correlated with visual cortex GABA concentration for obliquely oriented patterns (r = -0.65, p < 0.015) but did not reach significance for vertically oriented stimuli (r = -0.39, p = 0.2). Similarly, thresholds for obliquely oriented stimuli were negatively correlated with gamma oscillation frequency (r = -0.65, p < 0.017), but thresholds for vertical orientations were not (r = -0.02, p = 0.9). Gamma oscillation frequency was positively correlated with GABA concentration in primary visual cortex (r = 0.67, p < 0.013). These results confirm the importance of GABAergic inhibition in orientation selectivity and demonstrate, for the first time, that interindividual performance on a simple visual task is linked to neurotransmitter concentration. The results also suggest a key role for GABAergic gamma oscillations in visual discrimination tasks.
Figures
References
-
- Adjamian P, Holliday IE, Barnes GR, Hillebrand A, Hadjipapas A, Singh KD. Induced visual illusions and gamma oscillations in human primary visual cortex. Eur J Neurosci. 2004;20:587–592. - PubMed
-
- Allison JD, Bonds AB. Inactivation of the infragranular striate cortex broadens orientation tuning of supragranular visual neurons in the cat. Exp Brain Res. 1994;101:415–426. - PubMed
-
- Appelle S. Perception and discrimination as a function of stimulus orientation: the “oblique effect” in man and animals. Psychol Bull. 1972;78:266–278. - PubMed
-
- Bartos M, Vida I, Jonas P. Synaptic mechanisms of synchronized gamma oscillations in inhibitory interneuron networks. Nat Rev Neurosci. 2007;8:45–56. - PubMed
-
- Bonds AB. An “oblique effect” in the visual evoked potential of the cat. Exp Brain Res. 1982;46:151–154. - PubMed
Publication types
MeSH terms
Substances
LinkOut - more resources
Full Text Sources