Comparative Study
. 2009 Dec 16;29(50):15796-809.
doi: 10.1523/JNEUROSCI.4103-09.2009.

Direct interaction of GABAB receptors with M2 muscarinic receptors enhances muscarinic signaling

Affiliations
Comparative Study

Direct interaction of GABAB receptors with M2 muscarinic receptors enhances muscarinic signaling

Stephanie B Boyer et al. J Neurosci. .

Abstract

Downregulation of G-protein-coupled receptors (GPCRs) provides an important mechanism for reducing neurotransmitter signaling during sustained stimulation. Chronic stimulation of M(2) muscarinic receptors (M(2)Rs) causes internalization of M(2)R and G-protein-activated inwardly rectifying potassium (GIRK) channels in neuronal PC12 cells, resulting in loss of function. Here, we show that coexpression of GABA(B) R2 receptors (GBR2s) rescues both surface expression and function of M(2)R, including M(2)R-induced activation of GIRKs and inhibition of cAMP production. GBR2 showed significant association with M(2)R at the plasma membrane but not other GPCRs (M(1)R, mu-opioid receptor), as detected by fluorescence resonance energy transfer measured with total internal reflection fluorescence microscopy. Unique regions of the proximal C-terminal domains of GBR2 and M(2)R mediate specific binding between M(2)R and GBR2. In the brain, GBR2, but not GBR1, biochemically coprecipitates with M(2)R and overlaps with M(2)R expression in cortical neurons. This novel heteromeric association between M(2)R and GBR2 provides a possible mechanism for altering muscarinic signaling in the brain and represents a previously unrecognized role for GBR2.


Figures
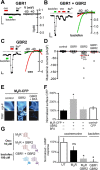
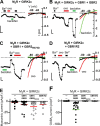
Figure 1.
Figure 1.
GABAB receptor expression rescues muscarinic-mediated GIRK signaling in neuronal PC12 cells. A–C, Representative current traces from neuronal PC12 cells (NGF treatment for 7 d) transfected with cDNA for GABABR1 (GBR1) (A), GABABR1 and GABABR2 (GBR1 + GBR2) (B), or GABABR2 (GBR2) (C). Whole-cell currents were recorded in 20 mm potassium (20K) in response to a voltage-ramp protocol (−120 to +50 mV; holding potential, −40 mV). The traces show the current recorded at −120 mV with 20K alone or 20K plus Ba2+ (1 mm) (black bars), oxotremorine-M (oxo) (10 μm) (red bars), or baclofen (100 μm) (green bars). The dashed lines represent zero current level. Calibration: 0.5 nA, 20 s. Insets, Current–voltage (I–V) plots for responses on left. D, Scatter plot shows muscarinic responses (+oxo) expressed as current density (in picoamperes per picofarad). The solid red lines show mean current density (N = 17–28 cells per condition with >3 transfections per condition). E, Representative images from neuronal PC12 cells expressing M2R-CFP either alone (left, control), coexpressed with GBR2-YFP (center, right), or coexpressed with GBR2-YFP and treated for 2 h with BFA (50 μm) (right). Cells were imaged under both epifluorescence (Epi-F) (top) and TIRF microscopy (bottom). Scale bar, 10 μm. F, Bar chart shows the mean surface expression for M2R-CFP measured under TIRF for cells expressing M2R-CFP alone, M2R/GBR2, or M2R/GBR2/BFA. Fluorescence was normalized to M2R-CFP. Control cells were transfected with CFP cDNA alone. The asterisk indicates statistical difference (p < 0.05) from M2R-CFP. G, Schematics show neuronal PC12 cells transfected with M2R alone or M2R/GBR2 cDNA and treated with 10 μm oxotremorine, or GBR1/GBR2 cDNA and treated with baclofen (100 μm) for 30 min, after forskolin stimulation (10 μm). The bar chart shows the effect of oxotremorine or baclofen on forskolin-stimulated cAMP. cAMP levels were normalized to untransfected (UT) cells treated with forskolin only and expressed as a percentage of forskolin-stimulated cAMP levels. The asterisk indicates statistical differences (p < 0.05 vs UT for 3 experiments). Error bars indicate SEM.
Figure 2.
Figure 2.
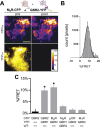
GBR2 and M2R interact at the plasma membrane in neuronal PC12 cells. A, Representative images from neuronal PC12 cells expressing M2R-CFP and GBR2-YFP. Cells were imaged using TIRF microscopy before (pre) and after (post) 60 s photobleaching YFP with a 514 nm laser. Images were collected for the CFP channel (CFPEM) and the YFP channel (YFPEM). Images are scaled to the same intensity. Scale bar, 10 μm. B, Histogram shows the distribution percentage FRET calculated per pixel using NIH ImageJ–FRETcalc plugin. The data were fit with a Gaussian distribution. C, Bar chart shows percentage FRET (mean ± SEM) for each set of transfections. Only the GBR1/GBR2 and GBR2/M2R show significant detectable percentage FRET. The asterisk indicates statistical differences [p < 0.05 vs GBR2-CFP alone (black bar); N = 8–11 cells per condition with >3 transfections per condition].
Figure 3.
Figure 3.
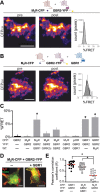
GBR2 and M2R but not other GPCRs produce FRET at the plasma membrane in HEK293 cells. A, B, Representative CFPEM images from HEK293 cells expressing GBR2-YFP and M2R-CFP (A) or GBR2-YFP, M2R-CFP, and wild-type GBR1 (B) before (pre) and after (post) photobleaching. FRET between GBR2-YFP and M2R-CFP requires GBR1 in HEK293 cells. YFPEM images have been omitted for clarity. Histograms to the right show the distribution of percentage FRET per pixel for the cell shown. Scale bar, 5 μm. C, Bar chart shows mean percentage FRET for the indicated transfection conditions. The asterisk indicates statistical differences [p < 0.05 vs GBR2-CFP alone (black bar); N = 8–18 cells per condition with >3 transfections per condition]. D, Representative TIRF images from cells expressing M2R-CFP (pseudocolored red) and GBR2-YFP (green) without (left) or with (right) wild-type GBR1. The overlap in expression between M2R-CFP and GBR2-YFP increases in the presence of GBR1. Scale bars, 5 μm. E, Pearson correlation Mander's coefficient measured with NIH ImageJ for CFP and YFP channels for the given receptor combination. Statistical differences are indicated by asterisk (p < 0.05 vs coexpressed M2R and GBR2; N = 18–21 cells per condition). Error bars indicate SEM.
Figure 4.
Figure 4.
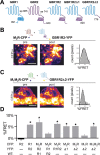
C-terminal domain of M2R required for association with GBR2. A, Schematic illustrates the amino acid regions exchanged between the M1R and M2R to generate the M2M1R and M1M2R chimeras. B, C, Representative TIRF images from HEK293 cells transfected with cDNA for GBR2-YFP, GBR1, and either M2M1R-CFP (B) or M1M2R-CFP (C). Histograms show distribution of percentage FRET per pixels for each cell shown. Scale bars, 5 μm. D, The bar chart shows percentage FRET for each receptor pair. Statistical differences are indicated by asterisk [p < 0.05 vs GBR2-CFP alone (black bar); N = 9–23 cells per condition with >3 transfections per condition]. Error bars indicate SEM.
Figure 5.
Figure 5.
Proximal region of GBR2 C-terminal domain is required for association with M2R. A, Schematic illustrates the amino acid regions involved in constructing the GBR1R2 chimera and its truncations. B, C, Representative TIRF images from HEK293 cells expressing GBR1R2-YFP and M2R-CFP (B) or the truncated GABAB chimera, GBR1R2Δ2-YFP, and the muscarinic chimera M1M2R-CFP (C). Histograms show the percentage FRET per pixel for each cell shown. Scale bars, 5 μm. D, Bar chart shows mean percentage FRET for each transfection condition. Statistical differences are indicated by an asterisk [p < 0.05 vs GBR2-CFP alone (black bar); N = 8–20 cells per condition with >3 transfections per condition]. Error bars indicate SEM.
Figure 6.
Figure 6.
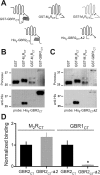
Proximal C-terminal domain of GBR2 binds directly to the M2R C-terminal domain. A, Schematic shows the design of GST- and His8-tagged fusion constructs for in vitro overlay binding assay. GST was fused to the M2R C terminus (GST-M2RCT), the M1R C terminus (GST-M1RCT), or the GBR1 C terminus (GST-GBR1CT). B, C, GBR2CT and GBR2CTΔ2 both bind to M2RCT but not to M1RCT. Representative Ponceau and Western blots. Membranes were incubated with 100 nm His8-GBR2CT (B) or His8-GBR2CTΔ2 (C). Ponceau-stained membranes (top) show size and concentration of GST-tagged fusion proteins. Note degradation for GST-M1RCT. Overlay blots were incubated with anti-His antibody to visualize bound protein (bottom). D, Bar graph shows the relative change in binding for GBR2CT and GBR2CTΔ2. OD of His8 bands were divided by the OD of the corresponding Ponceau-stained bands for GBR2CTΔ2 and normalized to GBR2CT (N = 3). Statistical difference is indicated by an asterisk (p < 0.05 by Student's t test). Error bars indicate SEM.
Figure 7.
Figure 7.
Rescue of muscarinic receptor-mediated currents is not dependent on activation of the GABAB receptor pathway. A–D, Representative current traces from neuronal PC12 cells expressing M2R and GIRK2c alone (A), or with GBR1/GBR2 (B), GBR1 and the G-protein signaling-deficient GBR2R575D (C), or the GBR1R2 chimera (D). Neuronal PC12 cells transfected with M2R and GIRK2c did not show either oxotremorine- or baclofen-induced GIRK currents. Expression of M2R with GBR1/GBR2R575D or GBR1R2 led to significant muscarinic-induced currents but no baclofen-induced GIRK currents. GBR1/GBR2 expression led to both muscarinic and baclofen-activated GIRK currents. Whole-cell currents were recorded in 20 mm potassium (20K) in response to a voltage-ramp protocol (−120 to +50 mV; holding potential, −40 mV). The traces show the current recorded at −120 mV with 20K alone or 20K plus Ba2+ (1 mm) (black bars), oxotremorine-M (oxo) (10 μm) (red bars), or baclofen (100 μm) (green bars). The dashed line represents zero current level. Calibration: 200 pA, 10 s. Current–voltage (I–V) plots are shown for different conditions. E, F, Scatter plots show summary of oxotremorine-M (muscarinic) (E) and baclofen (GABAB) (F) induced currents for different conditions. The solid lines show mean current density (N = 11–22 cells per condition with >3 transfections per condition).
Figure 8.
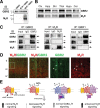
Figure 8.
Association of M2R with GBR2 in the mouse brain: a novel model for M2 muscarinic receptor signaling. A, Validation of anti-M2R antibody specificity. Immunoblot (IB) of membranes prepared from HEK293 cells expressing GBR2, GBR2/M1R, or GBR2/M2R using anti-M2R or anti-GBR2 antibodies. B, Western analysis using anti-M2R or anti-GBR2 antibodies shows overlapping expression of M2R and GBR2 in multiple regions of mouse brain. C, Biochemical association of M2R with GBR2 in mouse brain. Immunoprecipitations (IPs) with control IgG, anti-GBR2, anti-GBR1, or anti-M2R antibodies immobilized on protein A-Sepharose were performed with detergent-solubilized mouse cortical proteins. Precipitated material was analyzed by immunoblotting with anti-GBR1, -GBR2, or -M2R antibodies and visualizing using ECL. Input represents 10% of the material used for immunoprecipitation. The arrows indicate bands of predicted molecular weight. D, Immunostaining reveals colocalization of M2R and GBR2 in somatosensory cortex. Sections were stained with anti-M2R (red) and anti-GBR2 (green) antibodies. The right-hand panels represent an enlargement of the boxed area in the extreme left-hand panel. Scale bars, 20 μm and 2 μm. The arrows highlight dendritic regions of overlapping M2R and GBR2 expression. E, Signaling models for M2R and GBR1/GBR2 in the brain (left to right). Muscarinic M2R signaling under normal conditions involves activation of GIRK channels and inhibition of cAMP production. With prolonged exposure to agonist, M2Rs downregulate via endocytosis, leading to reduced G-protein signaling. GBR1/GBR2 heterodimer signaling is unaffected by cholinergic agonist. GBR2 association with M2R restores muscarinic G-protein signaling. A direct physical interaction between the C-terminal domains (dashed box indicates binding regions) mediates the association. Note the proximal C-terminal domain of GBR2 subunit mediates binding with M2R, whereas the coiled-coil regions are involved in GBR2/GBR1 dimerization.

Similar articles

Cited by

References

    1. Apergis-Schoute J, Pinto A, Paré D. Muscarinic control of long-range GABAergic inhibition within the rhinal cortices. J Neurosci. 2007;27:4061–4071. - PMC - PubMed
    1. Binet V, Duthey B, Lecaillon J, Vol C, Quoyer J, Labesse G, Pin JP, Prézeau L. Common structural requirements for heptahelical domain function in class A and class C G protein-coupled receptors. J Biol Chem. 2007;282:12154–12163. - PMC - PubMed
    1. Blein S, Ginham R, Uhrin D, Smith BO, Soares DC, Veltel S, McIlhinney RA, White JH, Barlow PN. Structural analysis of the complement control protein (CCP) modules of GABA(B) receptor 1a: only one of the two CCP modules is compactly folded. J Biol Chem. 2004;279:48292–48306. - PubMed
    1. Calver AR, Michalovich D, Testa TT, Robbins MJ, Jaillard C, Hill J, Szekeres PG, Charles KJ, Jourdain S, Holbrook JD, Boyfield I, Patel N, Medhurst AD, Pangalos MN. Molecular cloning and characterisation of a novel GABAB-related G-protein coupled receptor. Brain Res Mol Brain Res. 2003;110:305–317. - PubMed
    1. Chang W, Tu C, Cheng Z, Rodriguez L, Chen TH, Gassmann M, Bettler B, Margeta M, Jan LY, Shoback D. Complex formation with the type B gamma-aminobutyric acid receptor affects the expression and signal transduction of the extracellular calcium-sensing receptor. Studies with HEK-293 cells and neurons. J Biol Chem. 2007;282:25030–25040. - PubMed

Publication types

LinkOut - more resources