Comparative Study
. 2009 Dec 16;29(50):15898-909.
doi: 10.1523/JNEUROSCI.1949-09.2009.

Auditory cortical activity after intracortical microstimulation and its role for sensory processing and learning

Affiliations
Comparative Study

Auditory cortical activity after intracortical microstimulation and its role for sensory processing and learning

Matthias Deliano et al. J Neurosci. .

Abstract

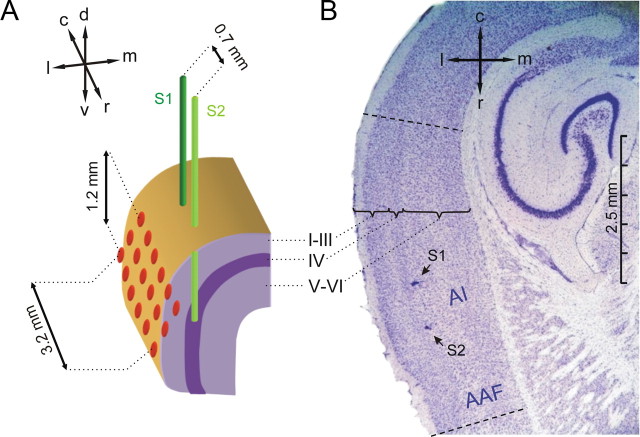
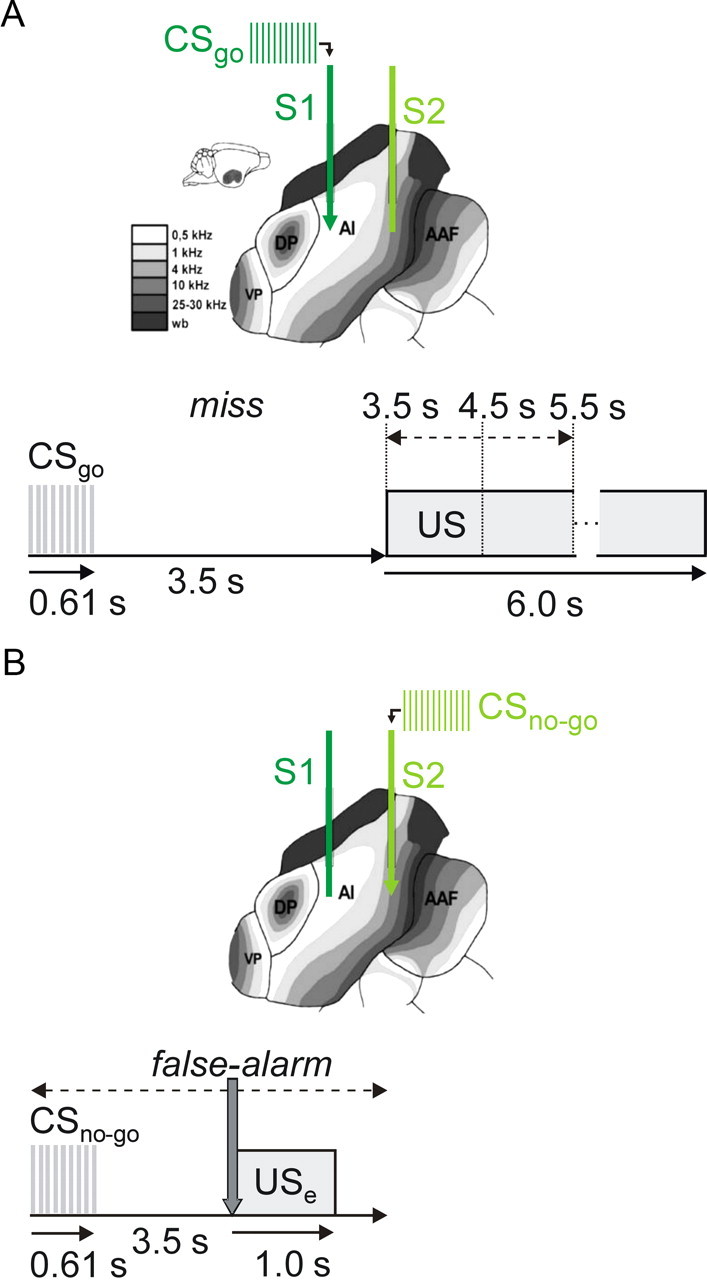
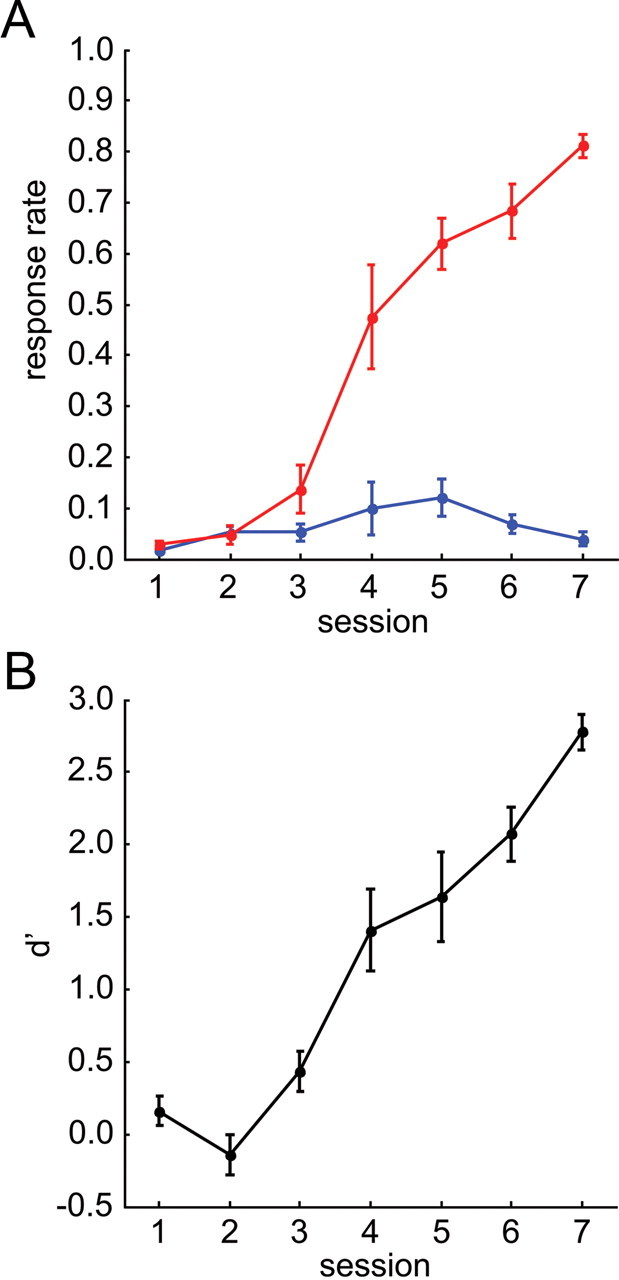
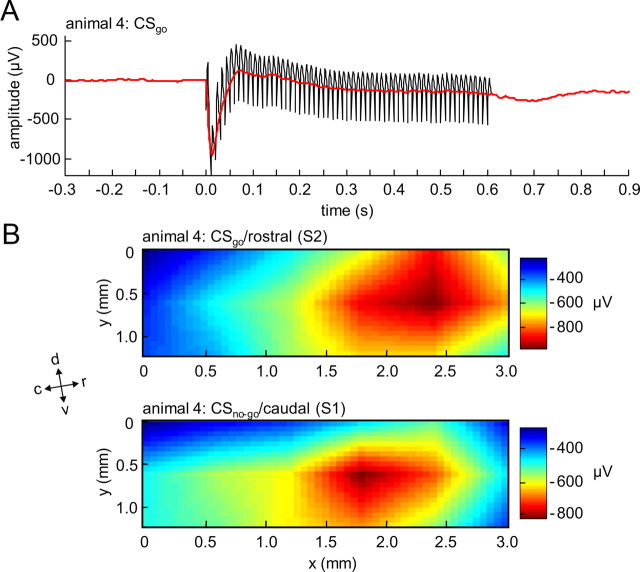
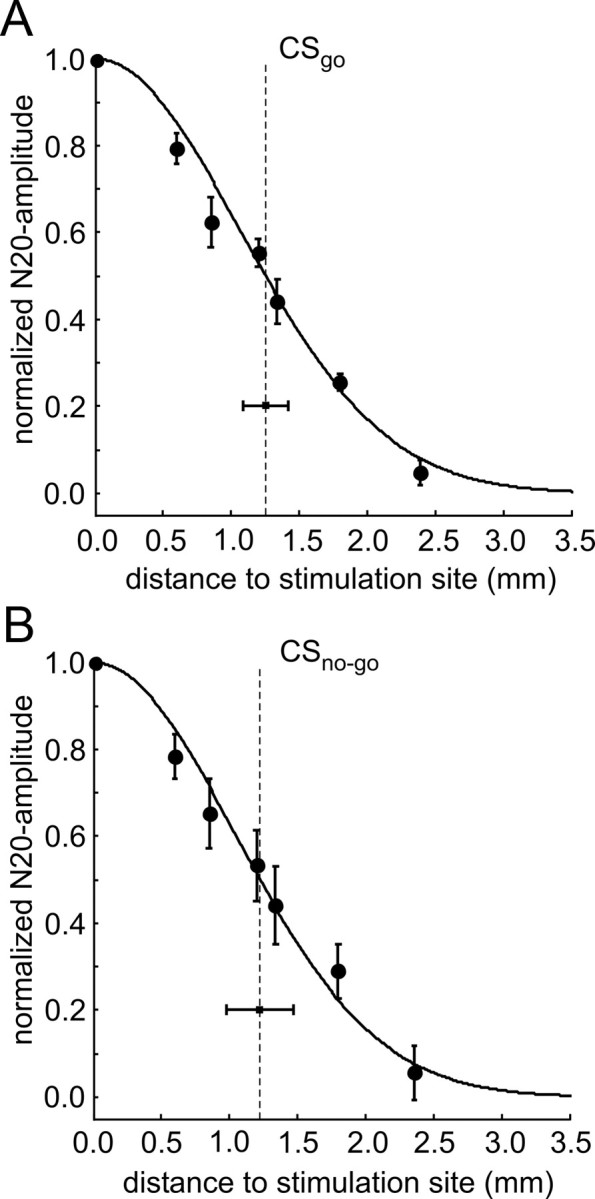
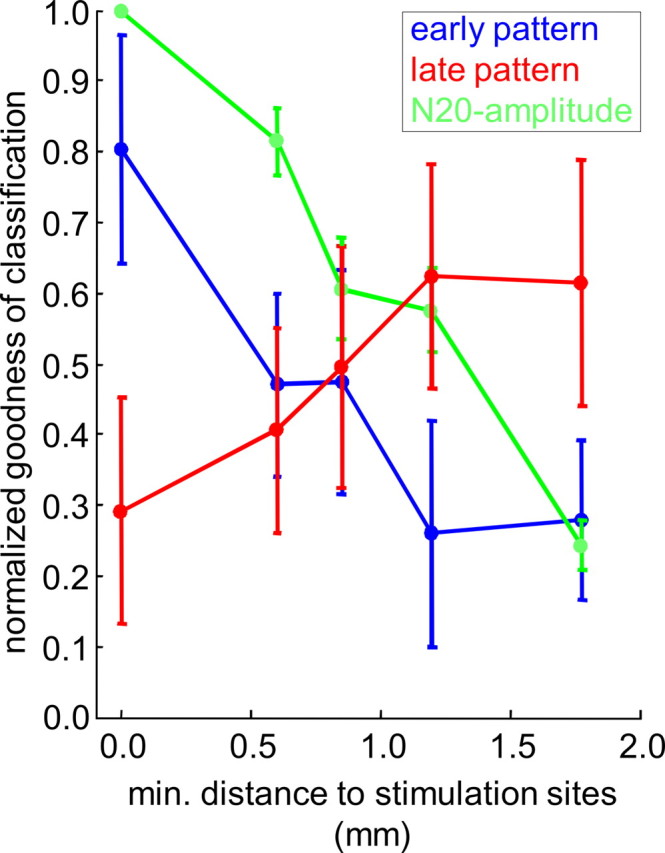
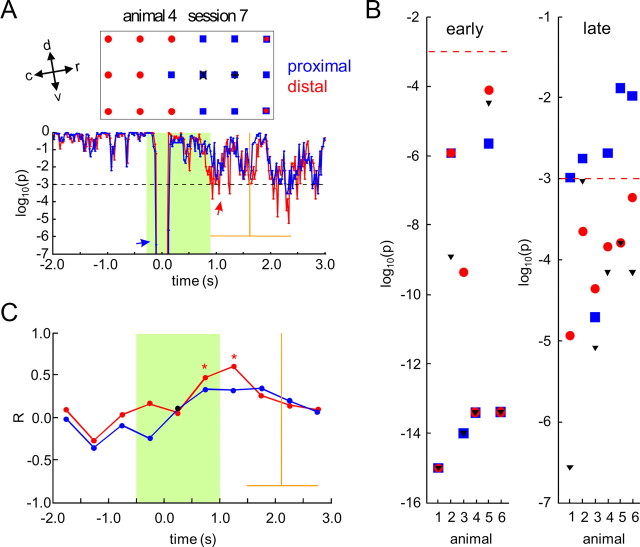
Several studies have shown that animals can learn to make specific use of intracortical microstimulation (ICMS) of sensory cortex within behavioral tasks. Here, we investigate how the focal, artificial activation by ICMS leads to a meaningful, behaviorally interpretable signal. In natural learning, this involves large-scale activity patterns in widespread brain-networks. We therefore trained gerbils to discriminate closely neighboring ICMS sites within primary auditory cortex producing evoked responses largely overlapping in space. In parallel, during training, we recorded electrocorticograms (ECoGs) at high spatial resolution. Applying a multivariate classification procedure, we identified late spatial patterns that emerged with discrimination learning from the ongoing poststimulus ECoG. These patterns contained information about the preceding conditioned stimulus, and were associated with a subsequent correct behavioral response by the animal. Thereby, relevant pattern information was mainly carried by neuron populations outside the range of the lateral spatial spread of ICMS-evoked cortical activation (approximately 1.2 mm). This demonstrates that the stimulated cortical area not only encoded information about the stimulation sites by its focal, stimulus-driven activation, but also provided meaningful signals in its ongoing activity related to the interpretation of ICMS learned by the animal. This involved the stimulated area as a whole, and apparently required large-scale integration in the brain. However, ICMS locally interfered with the ongoing cortical dynamics by suppressing pattern formation near the stimulation sites. The interaction between ICMS and ongoing cortical activity has several implications for the design of ICMS protocols and cortical neuroprostheses, since the meaningful interpretation of ICMS depends on this interaction.


Figures

Figure 1.
Figure 1.
Positioning of electrodes. A, A pair of stimulation electrodes S1 (dark green) and S2 (light green) was implanted into the depth of the right AI close to its input layer IV. Electrode tips were positioned along the rostrocaudal axis of AI (caudal electrode S1, rostral electrode S2) with an interelectrode distance of ∼0.7 mm. A 3 × 6 ECoG recording array (red) with 0.6 mm interelectrode distances was centered epidurally over the right AI. Anatomical directions are indicated by arrows (d, dorsal; c, caudal; l, lateral; m, medial; r, rostral; v, ventral). B, Nissl-stained horizontal section showing two small lesions (arrows) at the tips of the two implanted stimulation electrodes indicating their location within temporal cortex. The cortical layering is marked by the curly brackets. The rostrocaudal extent of the auditory core fields [AI and anterior auditory field (AAF)] is indicated by dashed lines, and can be approximately determined from the pronounced layer IV in these fields identifiable by the band of densely packed cells at a cortical depth of ∼0.5 mm.
Figure 2.
Figure 2.
ICMS and behavioral paradigm. A, B, Gerbil AI has a tonotopic organization with a caudal-to-rostral gradient of increasing frequencies. Accordingly, the caudal stimulation electrode S1 was positioned in a lower-frequency part of AI than the rostral electrode S2. The schematic views show the case of a CSgo delivered at S1 (A) and a CSno-go at S2 (B). Using a go/(no-go) active avoidance paradigm, animals were trained in a two-compartment shuttle-box to discriminate between two sites (S1 and S2) of ICMS (0.61 s train length). At the beginning of go-trials (A), ICMS was delivered through one of the two stimulation electrodes (CSgo), and in no-go-trials (B) through the other electrode (CSno-go), respectively. Within a random delay after CSgo onset of 3.5, 4.5, or 5.5 s (indicated by the dashed arrow in A), animals had to change the shuttle-box compartment (go response, CRgo), to avoid a mild electrical foot shock (US, 6.0 s maximum duration, terminated by compartment change). When the CSno-go was presented, animals had to stay in their compartment (no-go response, CRno-go) to avoid a mild electrical error-footshock (USe) with 1 s duration, given immediately after a compartment change (gray arrow in B) within the first 3.5 s after CSno-go onset. Behavioral responses were sorted in one of four categories: hit (CRgo to the CSgo), miss (CRno-go to the CSgo), false-alarm (CRgo to the CSno-go), and correct-rejection (CRno-go to the CSno-go).
Figure 3.
Figure 3.
Discrimination learning. A, Learning curves. Mean and SEs of the hit (red) and the false-alarm (blue) rate across animals is plotted over training sessions. B, Discrimination performance. Mean and SE of the sensitivity measure d′ across animals is plotted over training sessions.
Figure 4.
Figure 4.
Time course and spatial distribution of early ICMS-evoked activation. A, Typical example of an EEP from a single animal averaged across CSgo trials in a single session of training. The EEP is shown before (black) and after (red) removal of single pulse stimulus artifacts in the ECoG-recording (see Materials and Methods). A first, prominent negative peak in the EEP can be seen at a latency of ∼20 ms (N20, red arrow). B, Typical example of spatial distributions of the N20 amplitude in response to a CSgo at the rostral stimulation electrode (top) and to a CSno-go at the caudal stimulation electrode (bottom). Anatomical directions relative to the recording array are indicated by arrows (d, dorsal; c, caudal; l, lateral; m, medial; r, rostral; v, ventral).
Figure 5.
Figure 5.
Lateral spatial spread of ICMS-evoked activation. A, B, The normalized and binned EEP amplitude at the N20 latency is displayed as a function of distance to the stimulation site in response to CSgo (A) and CSno-go (B). Up to 1.3 mm from the stimulation site, normalized EEP amplitudes were binned and averaged across channels of equal distance (see Materials and Methods). As the position of stimulation sites varied relative to the recording array, broader bins had to be used at larger distances, to obtain amplitude values for all stimulus conditions and animals (the penultimate bin included N20 amplitudes at 1.7, 1.8, and 1.9 mm and the last bin N20 amplitudes between 2.1 and 3.2 mm). Grand mean and SE of the distance functions of EEP amplitudes across animals are displayed by circles and error bars. The lateral spread of early cortical activation evoked by CSgo and CSno-go was estimated by the half-width of a Gaussian fitted to each of the two grand mean distance functions, respectively (indicated by the vertical dashed lines) (see also Materials and Methods). Confidence intervals of the half-widths are displayed by horizontal bars.
Figure 6.
Figure 6.
Spatial patterns in the β- and γ-bands of the ongoing ECoG. Significance of ECoG pattern classification (decadic logarithm of the p value) as a function of time relative to stimulus onset (time is given as the center of each 180 ms classification time frame stepped through the ECoG in 20 ms steps). A, B, A typical example is shown for sessions from the beginning (A) and the end (B) of training. Mean and SD of hit reaction times in the last session are displayed by vertical and horizontal orange lines, respectively. The time range affected by the electrical stimulus, including the half-length of the classification frame (90 ms) and the length of the filter kernel (200 ms), is marked by a green area. Arrows indicate highly significant peaks of pattern classification (p < 0.001, red dashed horizontal line) in the stimulus interval reflecting early, ICMS-evoked patterns (blue arrows), and late, learning-dependent patterns in the poststimulus/preresponse interval (red arrow).
Figure 7.
Figure 7.
Late spatial patterns in the ongoing ECoG and their relation to discrimination learning. A, Correlation between behavioral d′ and goodness of classification over sessions is plotted as a function of time relative to stimulus onset. Common correlation coefficients across animals were calculated over sessions between d′ values and maximum goodness of classification values selected from consecutive 500 ms time windows relative to stimulus onset in each session (z-standardized across sessions for each time window). Highly significant correlation (p < 0.01) is marked by asterisks. Statistical testing showed that homogeneity of correlation coefficients across animals held for all time windows (see Materials and Methods). Grand mean and SD of hit reaction times in the last session (pooled across animal) are displayed by vertical and horizontal orange lines, respectively. The time range affected by the electrical stimulus is marked by the green area. B, Detailed plots of the correlation for a prestimulus interval (−1.5 to −0.5 s, blue) and for the poststimulus/preresponse interval (1.0–1.5 s, red). C, Interaction plot showing the effects of factors CR (CRgo and CRno-go), and CS (CSgo and CSno-go) on correct pattern classification. Percentage correct classification was calculated separately for subsets of hit (CRgo,CSgo), miss (CRno-go,CSgo), false-alarm (CRgo,CSno-go), and correct-rejection (CRno-go,CSno-go) trials, at the latency of the maximum goodness of classification in the poststimulus/preresponse interval of the sessions containing the trials (behavioral response time was quantified by the mean hit reaction time in the session). Subsets consisted of the last n hit, miss, false-alarm, and correct-rejection trials collected across sessions 3–7 in each animal, respectively. To avoid biases due to different set sizes, n was matched to the size of the smallest set in each animal (n = 18 ± 9, mean ± SD), which always was the false-alarm set. Percentage correct values are plotted as a function of the factor CR, separately for the CSgo (red line) and the CSno-go (blue dashed line). Higher percentage correct values were found for hit (mean ± SE, 0.79 ± 6%) and correct-rejection (69 ± 4%) trials compared with false-alarm (57 ± 3%) and miss (59 ± 3%) trials. A two-way ANOVA (Huynh-Feldt corrected) with factors CR (CRgo and CRno-go) and CS (CSgo and CSno-go) was then applied to the percentage correct values across animals based on these trial subsets. A significant interaction was found between the factors CR and CS (F(1,5) = 7.417, p < 0.05), but no significant main effects, either for the factor CR (F(1,5) = 1.553, p ≥ 0.05) or the factor CS (F(1,5) = 2.259, p ≥ 0.05).
Figure 8.
Figure 8.
Timing of late spatial patterns relative to stimulus onset and behavioral response. A, Mean and SD of hit reaction time (top bar) and the latency of the most significant peak of pattern classification in the poststimulus/preresponse interval relative to stimulus onset (bottom bar). Data were pooled across animals and sessions with significant pattern classification. B, Mean and SD of the latency of the most significant peak of pattern classification as in A, but relative to the behavioral response in each session (mean of hit reaction times). Data were pooled as in A.
Figure 9.
Figure 9.
Spatial organization of early and late cortical activity patterns. Distance functions of discriminant pattern information are shown for early (blue) and late (red) patterns. Relative contribution of recording sites to pattern classification (see Materials and Methods) is displayed as a function of their minimal distance to the stimulation sites. Up to distances of 1.2 mm, relative contributions to classification were binned and averaged across channels with the same minimal distance. Larger distances from 1.3 to 3.2 mm were pooled in a single bin before averaging. Shown is the mean of the resulting distance functions across animals interval in the last session of training, for early patterns (blue), i.e., in the time frame of classification temporally overlapping the N20 peak in the EEP, and for the late patterns (red), i.e., in the time frame yielding most significant pattern classification in the poststimulus/preresponse. The green curve shows for comparison the mean and the SE of the distance function of EEP amplitudes at the latency of the N20 peak maximum across animals in the last session of training. Normalized EEP amplitudes were binned in the same way as for the distance function of discriminant information. In each animal, the resulting distance functions of the EEP were averaged across stimulus conditions.
Figure 10.
Figure 10.
Pattern classification with subsets of recording sites distal and proximal to the stimulation sites. A, Typical results of pattern classification with distal and proximal sets of recording channels from a single animal in the last session of training. In the top box, the selected distal and proximal recording channels are marked by red circles and blue squares, respectively. Stimulation sites determined within the coordinates of the recording array by the maxima of the spatial distribution of EEP amplitudes (Fig. 3B) are indicated by a + (CSgo at the rostral stimulation electrode) and by an x (CSno-go at the caudal stimulation electrode). Distal and proximal sets of channels were defined in each animal on the basis of the lateral spread of ICMS derived from the spatial analysis of the N20 peak in the EEP (see Results). Both sets matched in size. In the bottom, significance of ECoG pattern classification (decadic logarithm of the p value) is shown as a function of time relative to stimulus onset (Fig. 4A), separately for the distal (red) and the proximal (blue) set of recording channels. Mean and SD of hit reaction times are indicated by orange lines. B, p values obtained with distal (red circles) and proximal subsets (blue squares), and with the full set (black triangles) of recording channels in a time frame of classification temporally coinciding with the N20 component in EEP (left, early patterns), and in the time frame yielding most significant pattern classification in the poststimulus/preresponse interval (right, late pattern). Results are shown for all animals in the last session of training. A predefined level of significance (p < 0.001) is indicated by red dashed horizontal lines. C, Correlation between behavioral d′ and goodness of classification with distal (red) and proximal (blue) subsets of recording channels as a function of time relative to stimulus onset (Fig. 4B). Highly significant common correlation coefficients (p < 0.01) are marked by asterisks. Significant deviation from homogeneity across animals was found only for the correlation coefficients in the time interval between 0 and 500 ms after stimulus onset, with the proximal subset of recording channels (black circle).

Similar articles

Cited by

References

    1. Barrie JM, Freeman WJ, Lenhart MD. Spatiotemporal analysis of prepyriform, visual, auditory, and somesthetic surface EEGs in trained rabbits. J Neurophysiol. 1996;76:520–539. - PubMed
    1. Bartlett JR, DeYoe EA, Doty RW, Lee BB, Lewine JD, Negrão N, Overman WH., Jr Psychophysics of electrical stimulation of striate cortex in macaques. J Neurophysiol. 2005;94:3430–3442. - PubMed
    1. Bradley DC, Troyk PR, Berg JA, Bak M, Cogan S, Erickson R, Kufta C, Mascaro M, McCreery D, Schmidt EM, Towle VL, Xu H. Visuotopic mapping through a multichannel stimulating implant in primate V1. J Neurophysiol. 2005;93:1659–1670. - PubMed
    1. Brindley GS, Lewin WS. The sensations produced by electrical stimulation of the visual cortex. J Physiol. 1968;196:479–493. - PMC - PubMed
    1. Budinger E, Heil P, Scheich H. Functional organization of auditory cortex in the Mongolian gerbil (Meriones unguiculatus). III. Anatomical subdivisions and corticocortical connections. Eur J Neurosci. 2000;12:2425–2451. - PubMed

Publication types

LinkOut - more resources