Comparative Study
. 2009 Dec 16;29(50):15910-22.
doi: 10.1523/JNEUROSCI.4041-09.2009.

Adult plasticity in multisensory neurons: short-term experience-dependent changes in the superior colliculus

Affiliations
Comparative Study

Adult plasticity in multisensory neurons: short-term experience-dependent changes in the superior colliculus

Liping Yu et al. J Neurosci. .

Abstract

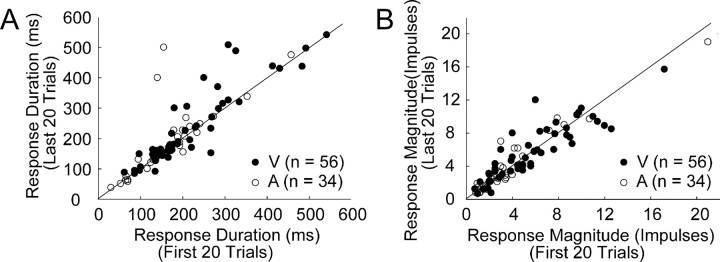
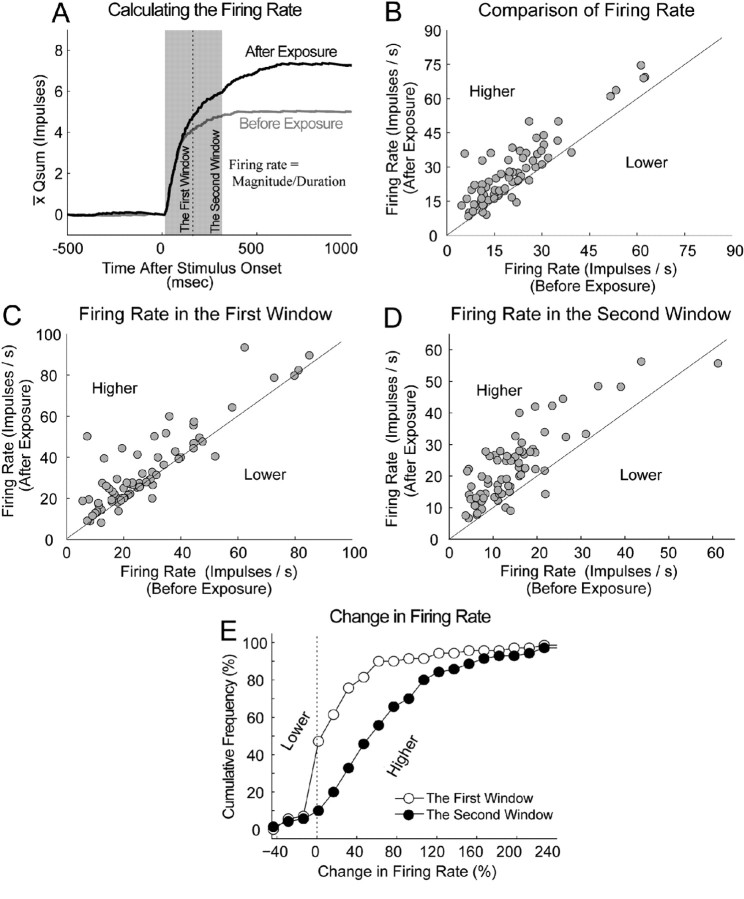
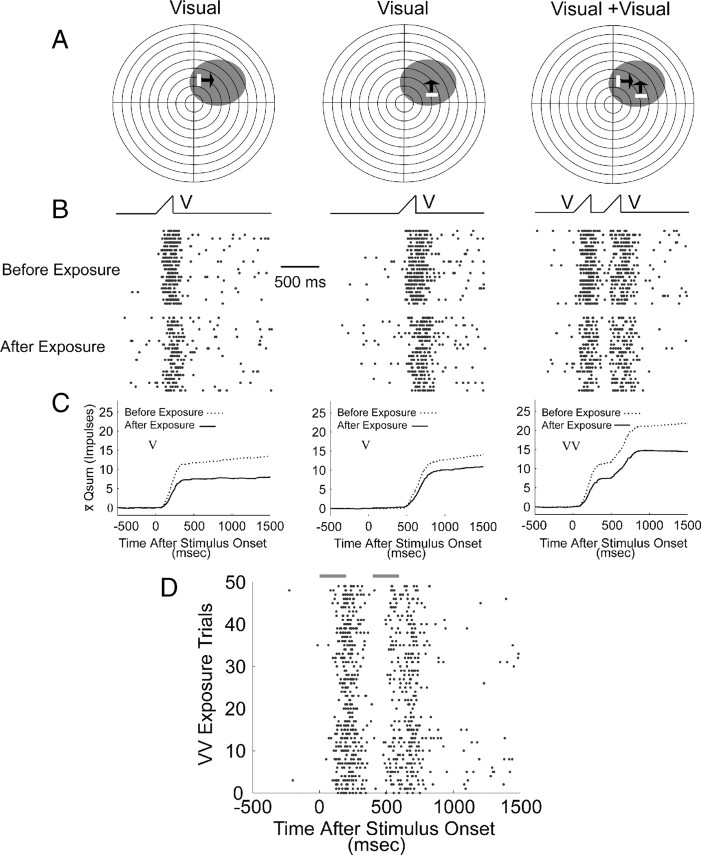
Multisensory neurons in the superior colliculus (SC) have the capability to integrate signals that belong to the same event, despite being conveyed by different senses. They develop this capability during early life as experience is gained with the statistics of cross-modal events. These adaptations prepare the SC to deal with the cross-modal events that are likely to be encountered throughout life. Here, we found that neurons in the adult SC can also adapt to experience with sequentially ordered cross-modal (visual-auditory or auditory-visual) cues, and that they do so over short periods of time (minutes), as if adapting to a particular stimulus configuration. This short-term plasticity was evident as a rapid increase in the magnitude and duration of responses to the first stimulus, and a shortening of the latency and increase in magnitude of the responses to the second stimulus when they are presented in sequence. The result was that the two responses appeared to merge. These changes were stable in the absence of experience with competing stimulus configurations, outlasted the exposure period, and could not be induced by equivalent experience with sequential within-modal (visual-visual or auditory-auditory) stimuli. A parsimonious interpretation is that the additional SC activity provided by the second stimulus became associated with, and increased the potency of, the afferents responding to the preceding stimulus. This interpretation is consistent with the principle of spike-timing-dependent plasticity, which may provide the basic mechanism for short term or long term plasticity and be operative in both the adult and neonatal SC.


Figures

Figure 1.
Figure 1.
Hypothetical changes in the response of a multisensory neuron to sequentially presented cross-modal stimuli as predicted by STDP. A, Depicted are the temporal profiles of two hypothetical input signals to the multisensory neuron (measured in arbitrary units on the y-axis) conveyed by the first and second stimulus when they are presented in isolation. The multisensory neuron is assumed to generate responses when the input exceeds its threshold (horizontal line). Solid lines indicate the input profiles before exposure to the sequential cross-modal stimuli, while the dotted line indicates how the input signal conveying the first stimulus (when presented in isolation) is predicted to be different after exposure; it evokes a more robust response with a longer duration (black arrow). B, Depicted is the temporal profile of the input signal to the multisensory neuron when the sequential cross-modal stimuli are presented before (solid line) and after (dotted line) a number of exposure trials. When the stimuli are presented in this manner (i.e., in tandem), the responses to both stimuli are more robust and the latency of the response to the second stimulus is decreased, giving the impression of a merged response (indicated by the shaded region).
Figure 2.
Figure 2.
Exposure to repeated presentation of a sequential cross-modal stimulus leads to a merging of the responses in SC multisensory neurons. A–D, Each panel illustrates the responses recorded from different exemplar neurons to repeated presentations of a sequential cross-modal stimulus, showing both impulse rasters (x-axis = time; y-axis = trials, ordered bottom to top) and peristimulus time histograms (top, 20 ms bin width) for the first and last 15 trials in the raster (shaded regions). Stimulus traces are represented by bars above the rasters. The arrows in the rasters point to the period between the two responses and correspond to the arrows in the peristimulus time histograms. Note that in the last 15 trials the initial quiescent period between the two responses has been replaced by a period of activity.
Figure 3.
Figure 3.
Repeated exposure to single modality-specific stimuli did not consistently or predictably affect the durations or magnitudes of subsequent responses to these stimuli in the population of multisensory neurons studied. A, B, Response durations (A) and average response magnitudes (B) obtained during the first 20 and last 20 trials within the period of exposure to repeated single modality-specific stimuli were plotted against one another. The data were obtained from responses to 56 visual (V) and 34 auditory (A) stimuli. Note that most points cluster around the line of unity.
Figure 4.
Figure 4.
The consequences of short-term exposure to sequential auditory and visual stimuli. A, Illustrated are the overlapping visual and auditory receptive fields (shaded) of this multisensory SC neuron and the placement of stimuli within them. Each concentric circle in the schematics represents 10° of sensory space. B, Responses to randomly interleaved auditory (left), visual (middle) and sequential cross-modal auditory-visual (right) stimuli before and after the sequential cross-modal exposure trials are depicted in raster displays (stimulus traces are depicted on the top). C, Qsum plots illustrate the temporal profiles of the responses before (dotted) and after (solid) the exposure trials. D, Impulse rasters of the responses to the sequential auditory-visual stimuli during the exposure trials (x-axis = time; y-axis = trials, ordered bottom to top). Note that during the exposure trials, activity began to appear within the former period of inactivity between the two responses. This was due to an increase in the duration of the auditory response and a decrease in the visual latency, so that the unisensory responses began to merge.
Figure 5.
Figure 5.
The consequences of short-term exposure to sequential visual and auditory stimuli. All conventions are the same as in Figure 4, except that the order of the stimuli in the cross-modal sequence was reversed (A, Illustration of the visual and auditory RFs and the placement of stimuli within them. B, Stimulus traces and impulse rasters acquired before and after exposure trials. C, Qsums illustrating the responses to each stimulus before and after exposure. D, Impulse raster acquired during the 60 exposure trials.) Note that the tendency of the visual and auditory responses to merge during the exposure trials was also evident in this configuration (D), suggesting that experience-induced changes in responses to sequential cross-modal stimuli are independent of the order of the modality-specific component stimuli.
Figure 6.
Figure 6.
Changes induced in the responses to individually presented modality-specific stimuli across the studied population as a consequence of repeated exposure to sequential cross-modal stimuli. A, The magnitudes of the responses (mean # impulses) to the first and second stimulus in the sequence (columns) with respect to their sensory modalities (rows) are compared before (x-axis) and after (y-axis) the exposure trials. B, The cumulative frequency distribution of changes in magnitude (collapsed across modality) expressed as percentage change (after vs before the exposure trials) for the responses to the first (filled) and second (unfilled) stimuli in the sequence when presented alone (vertical line at 0 indicates no change). Note the consistent increase in the magnitude of the response to the first stimulus after exposure to the sequential cross-modal stimuli. C and E follow the same conventions as A, illustrating the effects on the duration and latency of the responses, respectively. D and F follow the same conventions as B. The duration of the response to the first stimulus in the sequence was consistently longer (D), but not to the second stimulus. F, There were no consistent changes in the latency of the response to either stimulus (presented alone) as a consequence of the exposure to the cross-modal stimulus complex.
Figure 7.
Figure 7.
The effect of the cross-modal exposure trials on the response to the first stimulus was not uniform in time. A, The qsum (temporal profile) of the response of a typical neuron to the first stimulus before (black) and after (gray) repeated exposure to the cross-modal stimuli. Note that the initial phases of the responses were quite similar, while the latter portions were quite different. These are referred to, respectively, as the first and second window (gray rectangles). B–D, To evaluate this across the population, the firing rate (magnitude/duration) was calculated for the entire response window (B) and then separately for its first half (C) and second half (D). The results are summarized in the cumulative frequency distribution in E. The response to the first stimulus in the sequence consistently showed an increase in overall firing rate after exposure (B). The change in firing rate was consistently higher in the second half of the response.
Figure 8.
Figure 8.
Changes in the first and the second responses before and after exposure to repetitive sequential cross-modal trials. These data were collected from trials in which the first and second stimuli were presented in tandem. All conventions are the same as Figure 6. A, B, The magnitudes of both responses were consistently larger after the exposure trials when the stimuli were again presented in tandem. C, D, The durations of the responses to both stimuli were consistently longer after the exposure trials. E, F, As expected, the exposure trials had no consistent effect on the latency of the response to the first stimulus in the sequence; however, the response to the second stimulus in the sequence was consistently shorter after exposure.
Figure 9.
Figure 9.
Comparison of the changes in multisensory interactions before and after sequential cross-modal exposure. First, the responses to the second stimulus in the sequence are compared when the stimulus is presented alone and then in tandem (calculated as percentage difference). Second, changes in these values are evaluated before and after exposure, which are the data presented here. Conventions are the same as in previous figures. A, The greater enhancement of the response to the second stimulus is evident both in the scatter plot on the left (x-axis = % difference before exposure, y-axis = % difference after exposure) and the cumulative frequency distribution on the right. As shown in the cumulative frequency distribution, there was no consistent enhancement in magnitude before the exposure trials (unfilled circles), but there was after exposure (filled circles). B, The same observations were evident for enhancements in the duration of the response to the second stimulus. C, Latency shifts were present before exposure (as expected, see Rowland et al., 2007), but were substantially enhanced after exposure.
Figure 10.
Figure 10.
An example neuron illustrating that exposure to sequential visual stimuli failed to mimic the effects of exposure with sequential cross-modal stimuli. This figure uses the same conventions as Figures 4 and 5. A, The receptive fields and stimulus positions for this multisensory neuron. B, Stimulus traces and impulse rasters for the responses collected to the first visual stimulus (left), the second (middle), and the sequence of visual stimuli (right) before and after the exposure trials (D). C, Qsum traces before and after the visual-visual exposure trials. In this example, the responses to both stimuli increased in magnitude after exposure (this was not consistent across the population, see Fig. 12); however, unlike the cross-modal exposure samples, there was no tendency for the responses to merge.
Figure 11.
Figure 11.
An example neuron illustrating that exposure to sequential auditory stimuli failed to mimic the effects of exposure to sequential cross-modal stimuli. This figure uses the same conventions as Figures 4, 5, and 10. A, The receptive fields and stimulus positions for this multisensory neuron. B, Stimulus traces and impulse rasters for the responses collected to the first auditory stimulus (left), the second (middle), and the sequence of auditory stimuli (right) before and after the exposure trials (D). C, Qsum traces illustrating the virtual absence of any change in any of the responses before and after the auditory-auditory exposure trials.
Figure 12.
Figure 12.
Much like repeated exposure to modality-specific stimuli (Fig. 3), repeated exposure to sequential within-modal stimuli failed to induce the changes induced by exposure to sequential cross-modal stimuli in the sample population. A, The duration of the response to the first (filled) and second (unfilled) stimulus in the within-modal sequence are plotted before (x-axis) and after (y-axis) exposure. These data were collected during postexposure trials in which the stimuli were presented in tandem (i.e., they are to be compared to Fig. 8). Data points follow the line of unity and show no consistent or predictable effect of the exposure trials. B, C, The same observation is true for the magnitude (B) or latency (C) of either response.

References

    1. Alvarado JC, Stanford TR, Vaughan JW, Stein BE. Cortex mediates multisensory but not unisensory integration in superior colliculus. J Neurosci. 2007a;27:12775–12786. - PMC - PubMed
    1. Alvarado JC, Vaughan JW, Stanford TR, Stein BE. Multisensory versus unisensory integration: contrasting modes in the superior colliculus. J Neurophysiol. 2007b;97:3193–3205. - PubMed
    1. Alvarado JC, Rowland BA, Stanford TR, Stein BE. A neural network model of multisensory integration also accounts for unisensory integration in superior colliculus. Brain Res. 2008;1242:12–23. - PMC - PubMed
    1. Bell AH, Meredith MA, Van Opstal AJ, Munoz DP. Stimulus intensity modifies saccadic reaction time and visual response latency in the superior colliculus. Exp Brain Res. 2006;174:53–59. - PubMed
    1. Dahmen JC, Hartley DE, King AJ. Stimulus-timing-dependent plasticity of cortical frequency representation. J Neurosci. 2008;28:13629–13639. - PMC - PubMed

Publication types

LinkOut - more resources