

Long-term results of the pediatric oncology group studies for childhood acute lymphoblastic leukemia 1984-2001: a report from the children's oncology group
- PMID: 20016527
- PMCID: PMC4300959
- DOI: 10.1038/leu.2009.261
Long-term results of the pediatric oncology group studies for childhood acute lymphoblastic leukemia 1984-2001: a report from the children's oncology group
Abstract
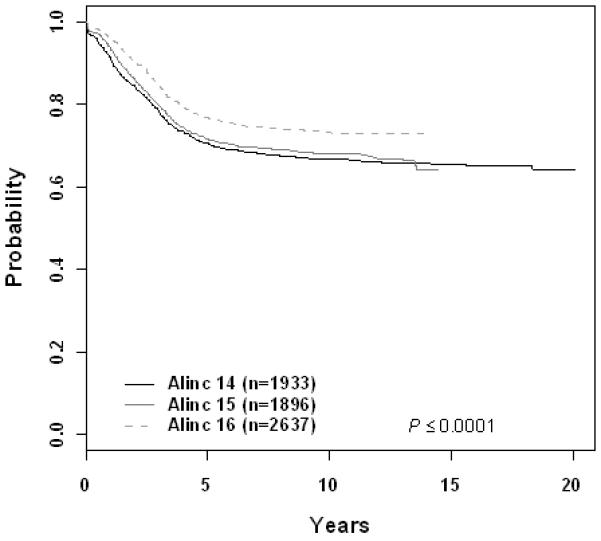
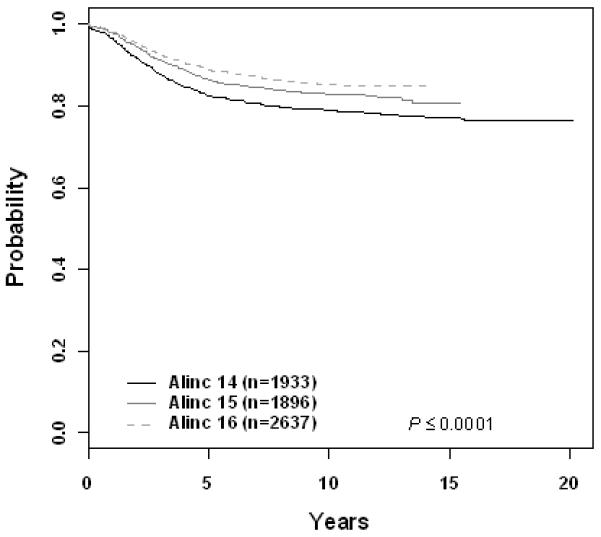
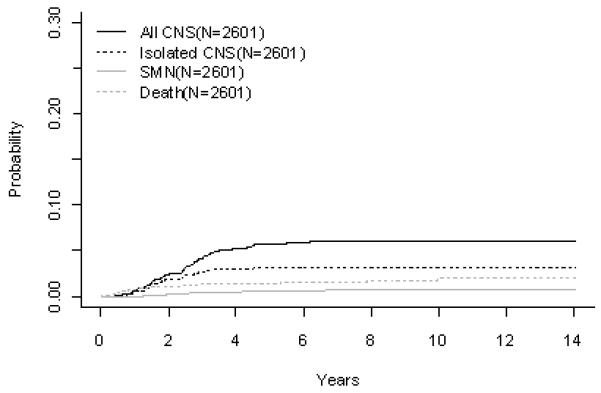
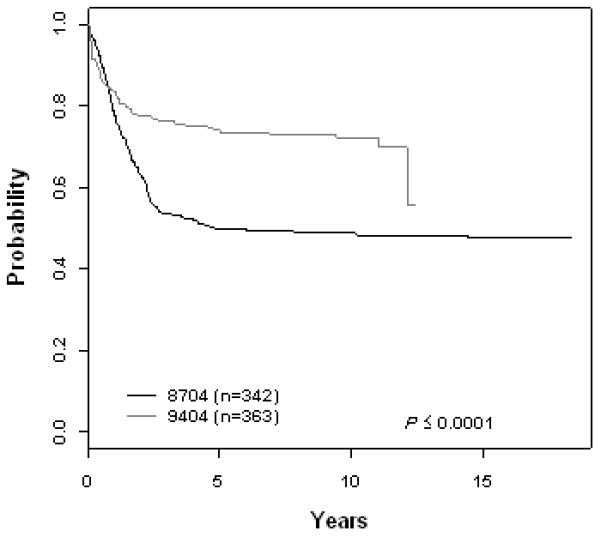
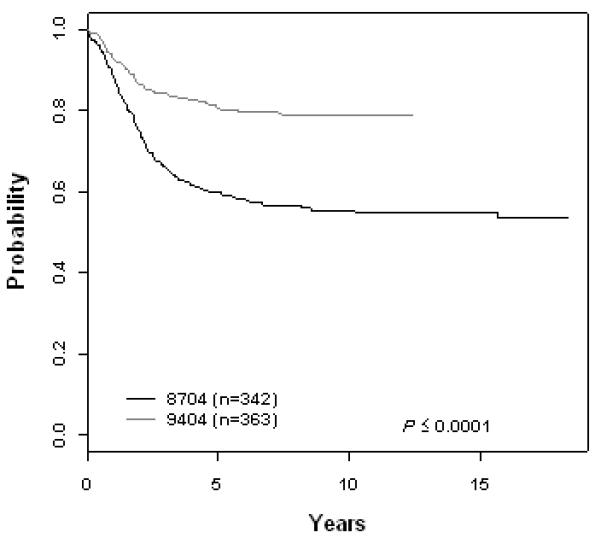
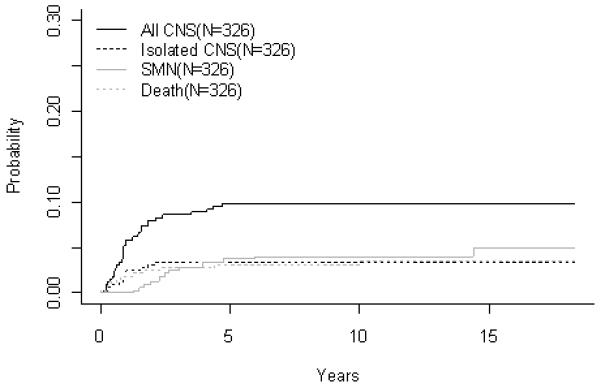
From 1984 to 2001, the Pediatric Oncology Group (POG) conducted 12 acute lymphoblastic leukemia (ALL) studies. Ten-year event-free survival (EFS) for patients >12 months of age with B-precursor ALL on acute leukemia in children 14, 15 and 16 series were 66.7+/-1.2%, 68.1+/-1.4% and 73.2+/-2.1%, respectively. Intermediate dose methotrexate (ID MTX; 1 g/m(2)) improved outcomes for standard risk patients (10-year EFS 77.5+/-2.7% vs 66.3+/-3.1% for oral MTX). Neither MTX intensification (2.5 g/m(2)) nor addition of cytosine arabinoside/daunomycin/teniposide improved outcomes for higher risk patients. Intermediate dose mercaptopurine (1 g/m(2)) failed to improve outcomes for either group. Ten-year EFS for patients with T-cell ALL, POG 8704 and 9404 were 49.1+/-3.1% and 72.2+/-4.7%, respectively. Intensive asparaginase (10-year EFS 61.8 vs 42.7%) and high-dose MTX (5 g/m(2)) (10-year EFS 78.0 vs 65.8%) improved outcomes. There was a non-significant improvement in EFS for infants (10-year EFS 17.7+/-7.2-31.9+/-8.3%). Prognostic indicators for B-precursor ALL were age and WBC at diagnosis, gender, central nervous system disease, DNA index and cytogenetic abnormalities. Only gender was prognostic in T-cell ALL. In infants, WBC and MLL translocation were linked to inferior outcome.
Figures
Similar articles
-
Long-term results of Tokyo Children's Cancer Study Group trials for childhood acute lymphoblastic leukemia, 1984-1999.Leukemia. 2010 Feb;24(2):383-96. doi: 10.1038/leu.2009.260. Epub 2009 Dec 24. Leukemia. 2010. PMID: 20033052 Clinical Trial.
-
Long-term results of Taiwan Pediatric Oncology Group studies 1997 and 2002 for childhood acute lymphoblastic leukemia.Leukemia. 2010 Feb;24(2):397-405. doi: 10.1038/leu.2009.248. Epub 2009 Dec 17. Leukemia. 2010. PMID: 20016538 Clinical Trial.
-
Long-term results of treatment of childhood acute lymphoblastic leukemia in the Czech Republic.Leukemia. 2010 Feb;24(2):425-8. doi: 10.1038/leu.2009.255. Epub 2009 Dec 17. Leukemia. 2010. PMID: 20016535 Clinical Trial. No abstract available.
-
Clinical heterogeneity in childhood acute lymphoblastic leukemia with 11q23 rearrangements.Leukemia. 2003 Apr;17(4):700-6. doi: 10.1038/sj.leu.2402883. Leukemia. 2003. PMID: 12682627 Review.
-
[Therapeutic strategies for childhood high-risk acute lymphoblastic leukemia].Beijing Da Xue Xue Bao Yi Xue Ban. 2013 Apr 18;45(2):327-32. Beijing Da Xue Xue Bao Yi Xue Ban. 2013. PMID: 23591360 Review. Chinese.
Cited by
-
Advances in the Biology of Acute Lymphoblastic Leukemia-From Genomics to the Clinic.J Adolesc Young Adult Oncol. 2011 Jun;1(2):77-86. doi: 10.1089/jayao.2011.0012. J Adolesc Young Adult Oncol. 2011. PMID: 23610732 Free PMC article.
-
Activating mutations in the NT5C2 nucleotidase gene drive chemotherapy resistance in relapsed ALL.Nat Med. 2013 Mar;19(3):368-71. doi: 10.1038/nm.3078. Epub 2013 Feb 3. Nat Med. 2013. PMID: 23377281 Free PMC article.
-
Chimeric Antigen Receptor T-Cell Therapy Clinical Results in Pediatric and Young Adult B-ALL.Hemasphere. 2019 Aug 7;3(4):e279. doi: 10.1097/HS9.0000000000000279. eCollection 2019 Aug. Hemasphere. 2019. PMID: 31723849 Free PMC article. Review.
-
Therapy-related myeloid neoplasms: pathobiology and clinical characteristics.Br J Pharmacol. 2011 Feb;162(4):792-805. doi: 10.1111/j.1476-5381.2010.01100.x. Br J Pharmacol. 2011. PMID: 21039422 Free PMC article. Review.
-
Dexrazoxane exposure and risk of secondary acute myeloid leukemia in pediatric oncology patients.Pediatr Blood Cancer. 2015 Apr;62(4):704-9. doi: 10.1002/pbc.25043. Epub 2014 Mar 26. Pediatr Blood Cancer. 2015. PMID: 24668949 Free PMC article.
References
-
- Fast Stats: An interactive tool for access to SEER cancer statistics. Surveillance Research Program, National Cancer Institute; [Accessed on 8-25-2009]. http://seer.cancer.gov/faststats.
-
- Pulte D, Gondos A, Brenner H. Trends in 5- and 10-year Survival After Diagnosis with Childhood Hematologic Malignancies in the United States, 1990-2004. J Natl Cancer Inst. 2008 Sep 17;100(18):1301–1309. 2008. - PubMed
-
- Harris MB, Shuster JJ, Pullen DJ, Borowitz MJ, Carroll AJ, Behm FG, et al. Consolidation therapy with antimetabolite-based therapy in standard-risk acute lymphocytic leukemia of childhood: a Pediatric Oncology Group Study. J Clin Oncol. 1998;16(8):2840–2847. - PubMed
-
- Harris MB, Shuster JJ, Pullen J, Borowitz MJ, Carroll AJ, Behm FG, et al. Treatment of children with early pre-B and pre-B acute lymphocytic leukemia with antimetabolite-based intensification regimens: a Pediatric Oncology Group Study. Leukemia. 2000 Sep;14(9):1570–1576. - PubMed
Publication types
MeSH terms
Grants and funding
LinkOut - more resources
Full Text Sources
Medical
