. 2009 Dec 17;462(7275):875-9.
doi: 10.1038/nature08653.

Growth landscape formed by perception and import of glucose in yeast

Affiliations

Growth landscape formed by perception and import of glucose in yeast

Hyun Youk et al. Nature. .

Abstract

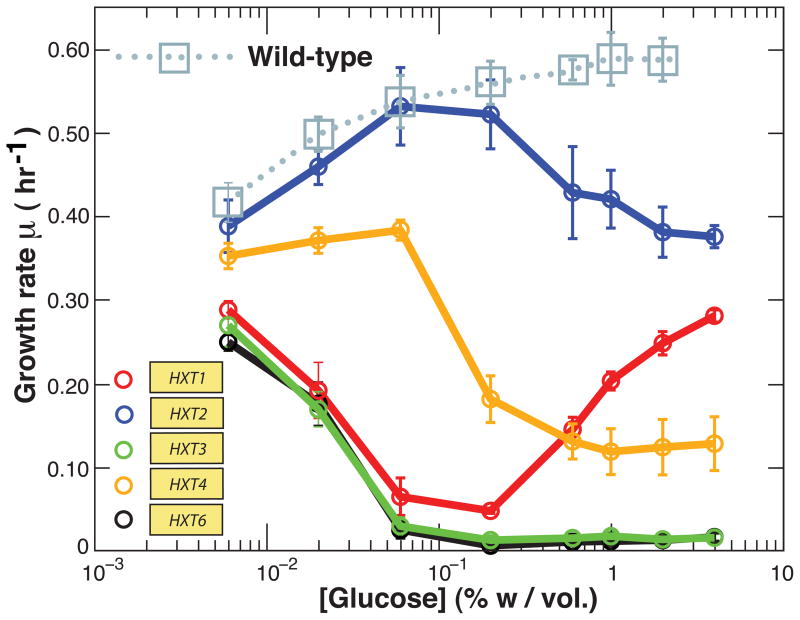
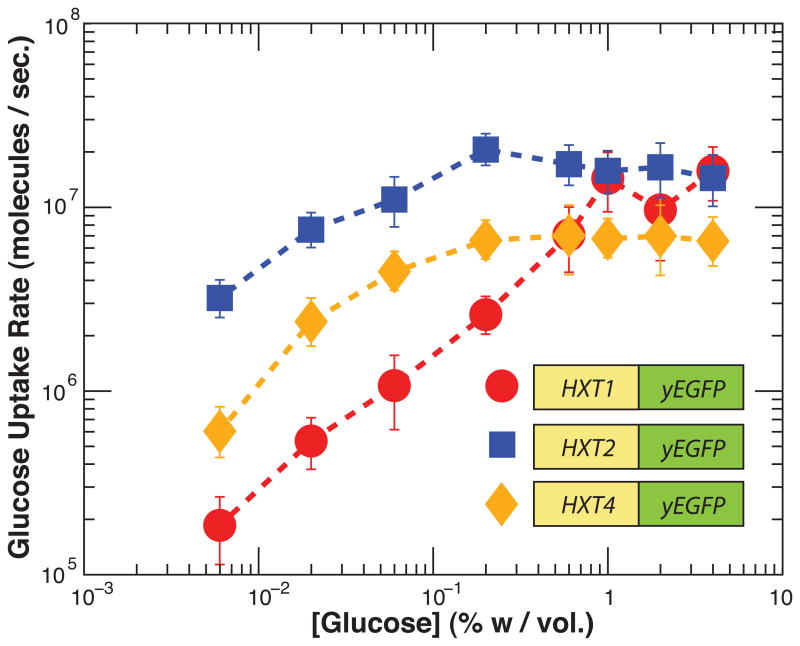
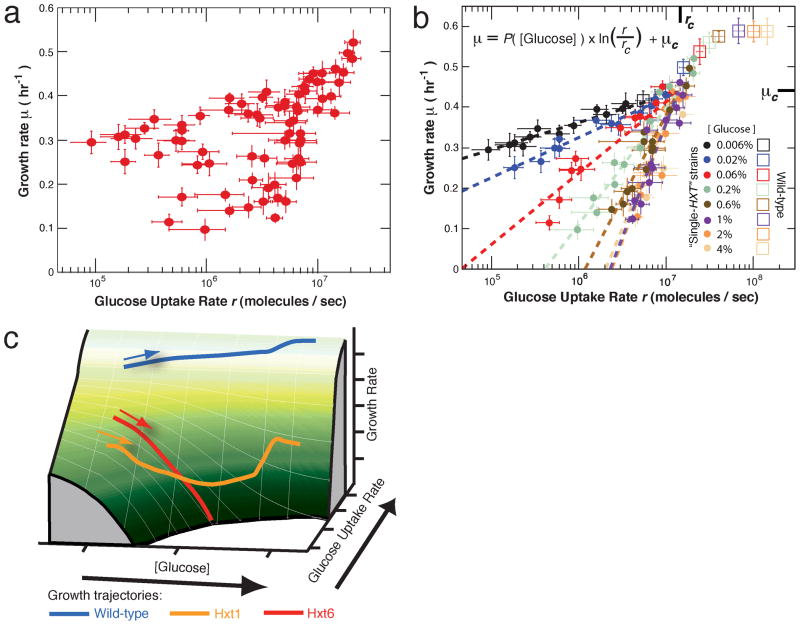
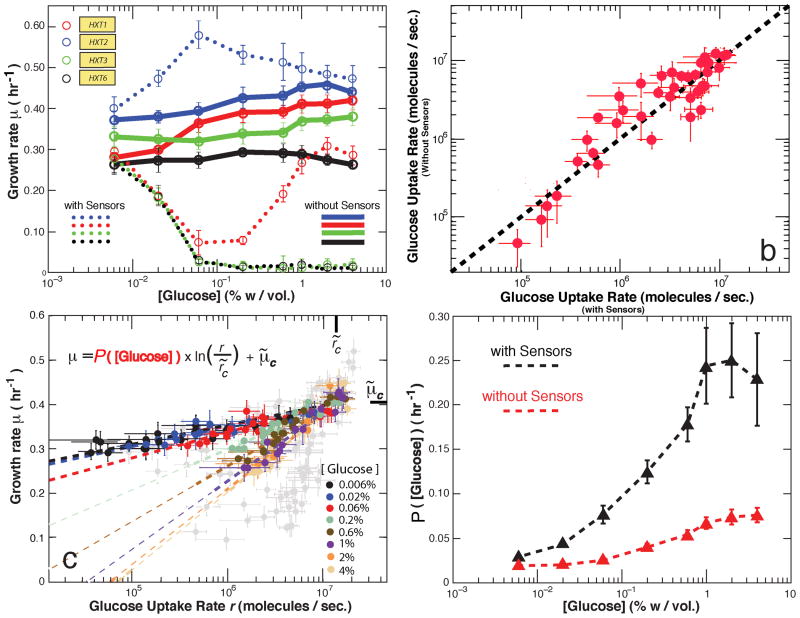
An important challenge in systems biology is to quantitatively describe microbial growth using a few measurable parameters that capture the essence of this complex phenomenon. Two key events at the cell membrane-extracellular glucose sensing and uptake-initiate the budding yeast's growth on glucose. However, conventional growth models focus almost exclusively on glucose uptake. Here we present results from growth-rate experiments that cannot be explained by focusing on glucose uptake alone. By imposing a glucose uptake rate independent of the sensed extracellular glucose level, we show that despite increasing both the sensed glucose concentration and uptake rate, the cell's growth rate can decrease or even approach zero. We resolve this puzzle by showing that the interaction between glucose perception and import, not their individual actions, determines the central features of growth, and characterize this interaction using a quantitative model. Disrupting this interaction by knocking out two key glucose sensors significantly changes the cell's growth rate, yet uptake rates are unchanged. This is due to a decrease in burden that glucose perception places on the cells. Our work shows that glucose perception and import are separate and pivotal modules of yeast growth, the interaction of which can be precisely tuned and measured.


Figures

Figure 1
Figure 1. Growth rates of “single-HXT” strains do not show any systematic trend with respect to glucose concentration
Log-phase growth rates of the wild-type strain (CEN.PK2-1C) and five single-HXT strains at varying [glucose] but constant [doxycycline] (0 μg/ml for wild-type and 2.5 μg/ml for single-HXT strains) are shown. The shape of each single-HXT strain’s growth-rate curve is maintained over a wide range of doxycycline concentrations (Supplementary Fig. 3). The growth-rate curves of the “single-HXT” strains display stark differences from the wild-type’s curve: single-HXT strains’ growth rates can substantially decrease, and some strains even approach growth arrest, despite a monotonic increase in [glucose]. Error bars, s.e.m.; n=3.
Figure 2
Figure 2. A rise in [glucose] yields an increase in the uptake rate, but cells do not necessarily grow faster
To both measure and calculate glucose uptake rates, yEGFP was fused to the HXT gene in each “single-HXT” strain. These fluorescent single-HXT strains have the same growth-rate features as their non-fluorescent counterparts shown in Fig. 1 (Supplementary Fig. 4). The measured glucose uptake rates per cell for just three of these fluorescent single-HXT strains at [doxycycline] = 2.5 μg/ml are shown here. These fluorescent single-HXT strains’ glucose uptake rates monotonically increase as [glucose] increases, despite the non-systematic behavior of their growth rates reflected in Fig. 1. Hence, a cell can grow faster, or slower, or approach growth arrest despite an increase in both its glucose uptake rate and [glucose]. Error bars, s.e.m.; n=3.
Figure 3
Figure 3. Emergence of a concise growth model incorporating cell’s perception and uptake rate of glucose, and the resulting “growth landscape”
a, b, Plotting together all the measured growth rates and glucose uptake rates of the fluorescent single-HXT strains (a) then color-coding by extracellular glucose level reveals this striking pattern (b). This plot shows that extracellular glucose concentration g and glucose uptake rate r are two independent variables. Growth rate is concisely described by the fit function μ(r, g). P(g) is the slope of the log-linear correlation between growth rate and uptake rate for each g; we obtain P(g) by fitting. μc and rc are constants specifying the point of convergence of the log-linear lines (μc = 0.44 hr−1, rc = 1.4×10⁷ molecules/s). Error bars, s.e.m.; n=3. c, Full “growth landscape” of budding yeast: Three dimensional plot of the function μ(r, g). The “growth trajectories” followed by the parental wild-type (blue path, near the peak of this landscape), and fluorescent “Hxt1-only” and “Hxt6-only” strains (orange and red paths respectively) are shown. Colored arrows indicate the direction the cell travels on each path as g increases. The arrows along the two axes (along “[glucose]” and “Glucose uptake rate”) point in the direction of increase.
Figure 4
Figure 4. Manipulation of the cell’s perception of extracellular glucose, leaving uptake rate unperturbed, can yield significant growth-rate changes
a, Growth rates of single-HXT strains lacking two glucose sensors (snf3Δrgt2Δ, bold lines) along with their counterparts with intact sensors (dotted lines) are shown for [doxycycline] = 5μg/ml. Error bars, s.e.m.; n=3. b, Knocking out the two glucose sensors leaves the cell’s glucose uptake rate virtually unperturbed. Just the “Hxt1-only” and “Hxt2-only” strains are shown here for simplicity (See Supplementary Figs. 7 & 12 for others). Each data point represents a particular combination of glucose and doxycycline concentrations. Error bars, s.e.m.; n=3. c, By yEGFP fusion, fluorescent sensor-less single-HXT strains were constructed for comparison with their sensor-intact counterparts. The features of growth rates seen in (a) were preserved after this fusion (Supplementary Figs. 11). Growth rates and glucose uptake rates of these strains were measured (Supplementary Figs. 12–15). For comparison, data for the sensor-intact single-HXT strains (from Fig. 3a) are shown in grey (μ̃c=0.40 hr−1, c=1.4×10⁷ molecules/s). Error bars, s.e.m.; n=3. d, The sensitivity function P(g), calculated from fitting the data in Fig. 3a and 4c is shown for strains with intact sensors (black) and snf3Δrgt2Δstrains (red). Error bars indicate 95% confidence interval in these fits.

Similar articles

Cited by

References

    1. Monod J. Recherches sur la croissance des cultures bacteriennes. Hermann et Cie; 1942.
    1. Bennet MR, et al. Metabolic gene regulation in a dynamically changing environment. Nature. 2008;454:1119–1122. - PMC - PubMed
    1. Zaslaver A, et al. Just-in-time transcription program in metabolic pathways. Nature Genetics. 2004;36:486–491. - PubMed
    1. Airoldi E, et al. Predicting cellular growth from gene expression signatures. PLoS Comp Biol. 2009;5:e1000257. - PMC - PubMed
    1. Dekel E, Alon U. Optimality and evolutionary tuning of the expression level of a protein. Nature. 2005;436:588–592. - PubMed

Publication types

MeSH terms