

E2f1-3 switch from activators in progenitor cells to repressors in differentiating cells
- PMID: 20016602
- PMCID: PMC2806193
- DOI: 10.1038/nature08677
E2f1-3 switch from activators in progenitor cells to repressors in differentiating cells
Abstract
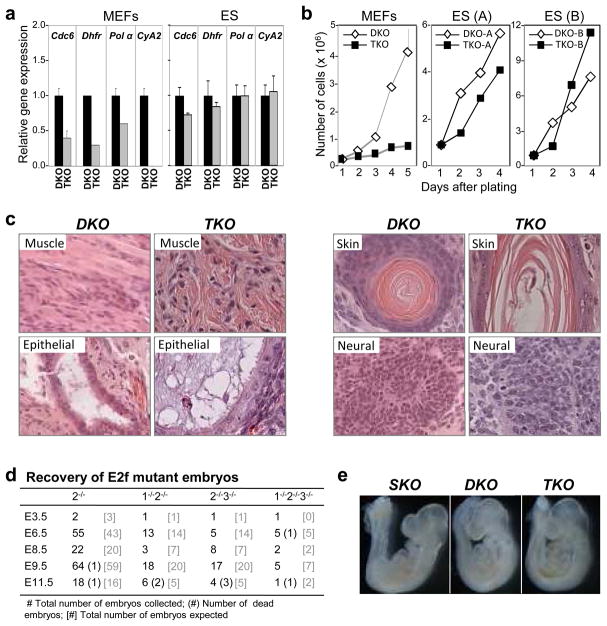
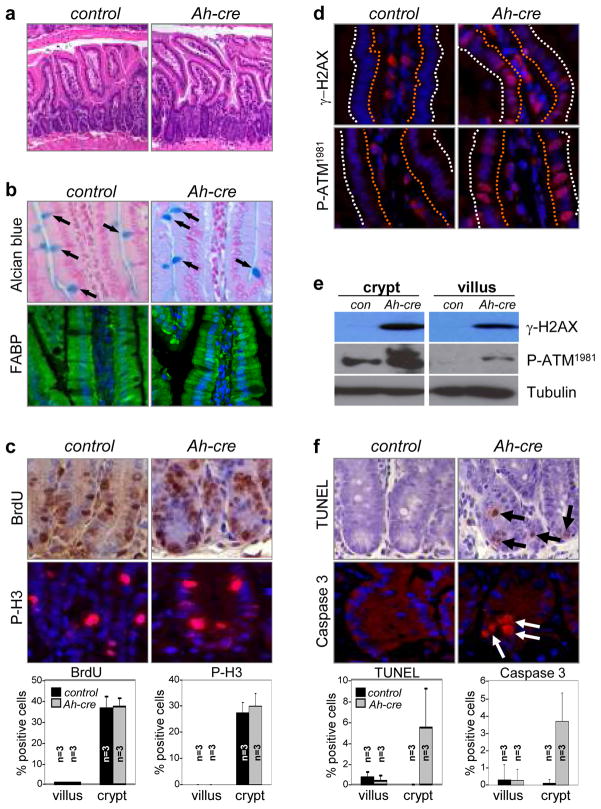
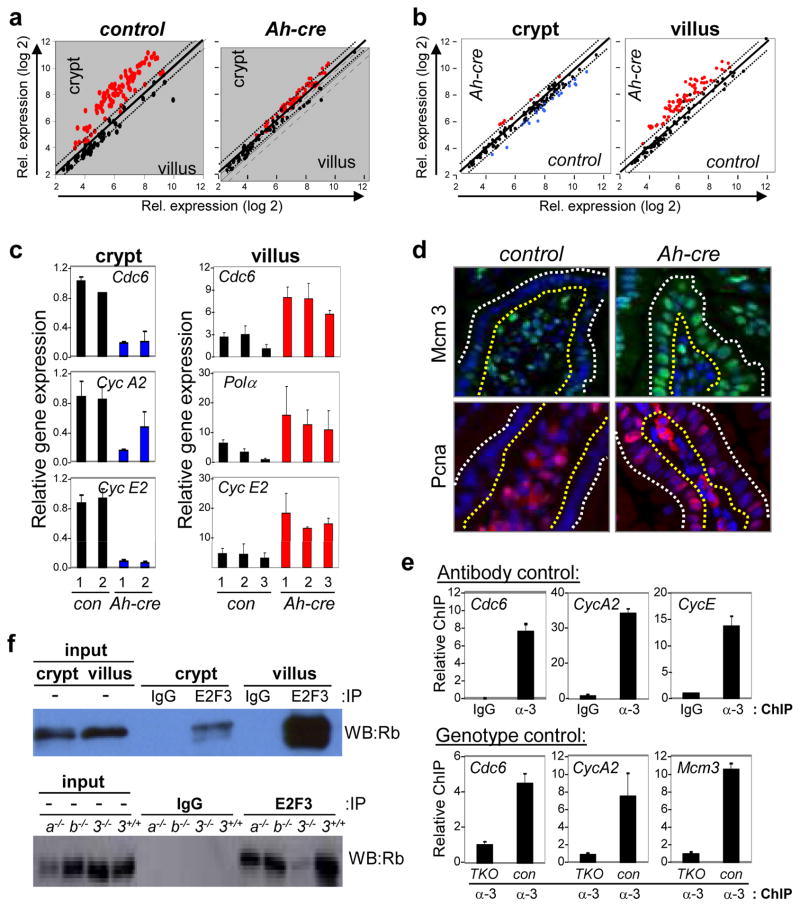
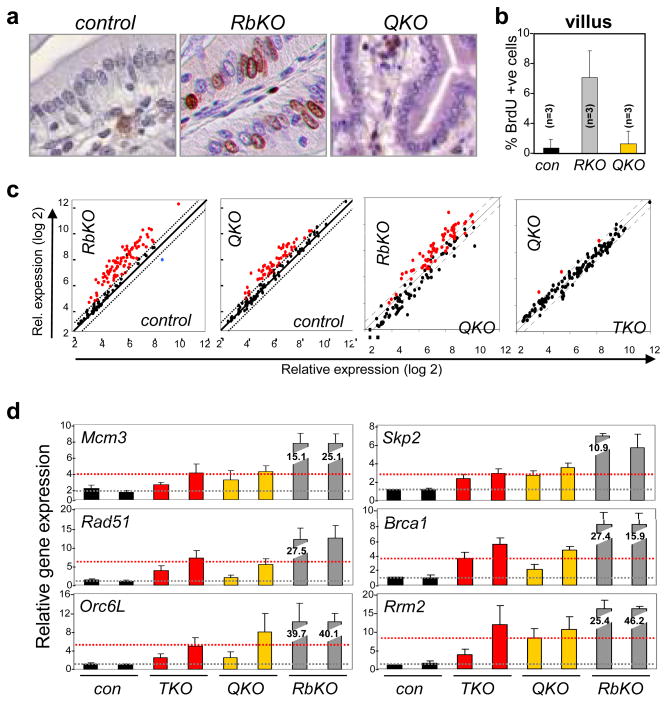
In the established model of mammalian cell cycle control, the retinoblastoma protein (Rb) functions to restrict cells from entering S phase by binding and sequestering E2f activators (E2f1, E2f2 and E2f3), which are invariably portrayed as the ultimate effectors of a transcriptional program that commit cells to enter and progress through S phase. Using a panel of tissue-specific cre-transgenic mice and conditional E2f alleles we examined the effects of E2f1, E2f2 and E2f3 triple deficiency in murine embryonic stem cells, embryos and small intestines. We show that in normal dividing progenitor cells E2f1-3 function as transcriptional activators, but contrary to the current view, are dispensable for cell division and instead are necessary for cell survival. In differentiating cells E2f1-3 function in a complex with Rb as repressors to silence E2f targets and facilitate exit from the cell cycle. The inactivation of Rb in differentiating cells resulted in a switch of E2f1-3 from repressors to activators, leading to the superactivation of E2f responsive targets and ectopic cell divisions. Loss of E2f1-3 completely suppressed these phenotypes caused by Rb deficiency. This work contextualizes the activator versus repressor functions of E2f1-3 in vivo, revealing distinct roles in dividing versus differentiating cells and in normal versus cancer-like cell cycles.
Figures
Similar articles
-
Redeployment of Myc and E2f1-3 drives Rb-deficient cell cycles.Nat Cell Biol. 2015 Aug;17(8):1036-48. doi: 10.1038/ncb3210. Epub 2015 Jul 20. Nat Cell Biol. 2015. PMID: 26192440 Free PMC article.
-
Division and apoptosis of E2f-deficient retinal progenitors.Nature. 2009 Dec 17;462(7275):925-9. doi: 10.1038/nature08544. Nature. 2009. PMID: 20016601 Free PMC article.
-
Mouse development with a single E2F activator.Nature. 2008 Aug 28;454(7208):1137-41. doi: 10.1038/nature07066. Epub 2008 Jun 25. Nature. 2008. PMID: 18594513 Free PMC article.
-
Retinoblastoma-E2F Transcription Factor Interplay Is Essential for Testicular Development and Male Fertility.Front Endocrinol (Lausanne). 2022 May 19;13:903684. doi: 10.3389/fendo.2022.903684. eCollection 2022. Front Endocrinol (Lausanne). 2022. PMID: 35663332 Free PMC article. Review.
-
Distinct and Overlapping Roles for E2F Family Members in Transcription, Proliferation and Apoptosis.Curr Mol Med. 2006 Nov;6(7):739-48. doi: 10.2174/1566524010606070739. Curr Mol Med. 2006. PMID: 17100600 Review.
Cited by
-
Integrative analysis of multiple cell death model for precise prognosis and drug response prediction in gastric cancer.Discov Oncol. 2024 Oct 8;15(1):532. doi: 10.1007/s12672-024-01411-4. Discov Oncol. 2024. PMID: 39377861 Free PMC article.
-
Network calisthenics: control of E2F dynamics in cell cycle entry.Cell Cycle. 2011 Sep 15;10(18):3086-94. doi: 10.4161/cc.10.18.17350. Epub 2011 Sep 15. Cell Cycle. 2011. PMID: 21900750 Free PMC article. Review.
-
Gene Prioritization through Consensus Strategy, Enrichment Methodologies Analysis, and Networking for Osteosarcoma Pathogenesis.Int J Mol Sci. 2020 Feb 5;21(3):1053. doi: 10.3390/ijms21031053. Int J Mol Sci. 2020. PMID: 32033398 Free PMC article.
-
Targeting tumor suppressor networks for cancer therapeutics.Curr Drug Targets. 2014 Jan;15(1):2-16. doi: 10.2174/1389450114666140106095151. Curr Drug Targets. 2014. PMID: 24387338 Free PMC article.
-
Dosage-dependent copy number gains in E2f1 and E2f3 drive hepatocellular carcinoma.J Clin Invest. 2017 Mar 1;127(3):830-842. doi: 10.1172/JCI87583. Epub 2017 Jan 30. J Clin Invest. 2017. PMID: 28134624 Free PMC article.
References
-
- Dimova DK, Dyson NJ. The E2F transcriptional network: old acquaintances with new faces. Oncogene. 2005;24:2810–2826. - PubMed
-
- Johnson DG, Schwarz JK, Cress WD, Nevins JR. Expression of transcription factor E2F1 induces quiescent cells to enter S phase. Nature. 1993;365:349–352. - PubMed
-
- Wu L, et al. The E2F1-3 transcription factors are essential for cellular proliferation. Nature. 2001;414:457–462. - PubMed
Publication types
MeSH terms
Substances
Associated data
- Actions
Grants and funding
LinkOut - more resources
Full Text Sources
Other Literature Sources
Molecular Biology Databases
