

FRET and mechanobiology
- PMID: 20016756
- PMCID: PMC2794131
- DOI: 10.1039/b913093b
FRET and mechanobiology
Abstract
Since the development of green fluorescent protein (GFP) and other fluorescent proteins (FPs) with distinct colors, genetically-encoded probes and biosensors have been widely applied to visualize the molecular localization and activities in live cells. In particular, biosensors based on fluorescence resonance energy transfer (FRET) have significantly advanced our understanding of the dynamic molecular hierarchy at subcellular levels. These biosensors have also been extensively applied in recent years to study how cells perceive the mechanical environment and transmit it into intracellular molecular signals (i.e. mechanotransduction). In this review, we will first provide a brief introduction of the recent development of FPs. Different FRET biosensors based on FPs will then be described. The last part of the review will be dedicated to the introduction of examples applying FRET biosensors to visualize mechanotransduction in live cells. In summary, the integration of FRET technology and the different cutting-edge mechanical stimulation systems can provide powerful tools to allow the elucidation of the mechanisms regulating mechanobiology at cellular and molecular levels in normal and pathophysiological conditions.
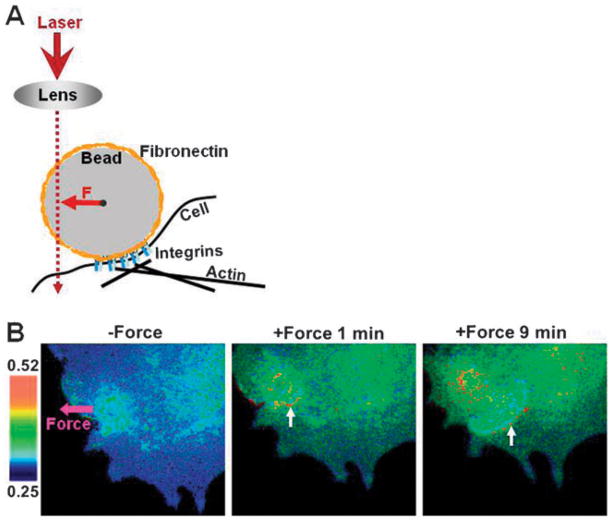
Figures


Similar articles
-
Live cell imaging of mechanotransduction.J R Soc Interface. 2010 Jun 6;7 Suppl 3(Suppl 3):S365-75. doi: 10.1098/rsif.2010.0042.focus. Epub 2010 Mar 31. J R Soc Interface. 2010. PMID: 20356874 Free PMC article. Review.
-
Fluorescence proteins, live-cell imaging, and mechanobiology: seeing is believing.Annu Rev Biomed Eng. 2008;10:1-38. doi: 10.1146/annurev.bioeng.010308.161731. Annu Rev Biomed Eng. 2008. PMID: 18647110 Review.
-
FRET imaging.Nat Biotechnol. 2003 Nov;21(11):1387-95. doi: 10.1038/nbt896. Nat Biotechnol. 2003. PMID: 14595367 Review.
-
[Applications of FRET technology in the study of mechanotransduction].Sheng Wu Yi Xue Gong Cheng Xue Za Zhi. 2013 Dec;30(6):1362-7. Sheng Wu Yi Xue Gong Cheng Xue Za Zhi. 2013. PMID: 24645627 Review. Chinese.
-
Application of FRET Biosensors in Mechanobiology and Mechanopharmacological Screening.Front Bioeng Biotechnol. 2020 Nov 9;8:595497. doi: 10.3389/fbioe.2020.595497. eCollection 2020. Front Bioeng Biotechnol. 2020. PMID: 33240867 Free PMC article. Review.
Cited by
-
Imaging the high-affinity state of the dopamine D2 receptor in vivo: fact or fiction?Biochem Pharmacol. 2012 Jan 15;83(2):193-8. doi: 10.1016/j.bcp.2011.09.008. Epub 2011 Sep 16. Biochem Pharmacol. 2012. PMID: 21945484 Free PMC article. Review.
-
A Perspective of Epigenetic Regulation in Radiotherapy.Front Cell Dev Biol. 2021 Feb 18;9:624312. doi: 10.3389/fcell.2021.624312. eCollection 2021. Front Cell Dev Biol. 2021. PMID: 33681204 Free PMC article. Review.
-
Documentation and localization of force-mediated filamin A domain perturbations in moving cells.Nat Commun. 2014 Aug 14;5:4656. doi: 10.1038/ncomms5656. Nat Commun. 2014. PMID: 25120197 Free PMC article.
-
Mechanosensitive Channel-Based Optical Membrane Tension Reporter.ACS Sens. 2023 Jan 27;8(1):12-18. doi: 10.1021/acssensors.2c01921. Epub 2023 Jan 6. ACS Sens. 2023. PMID: 36608338 Free PMC article.
-
Rapid activation of Rac GTPase in living cells by force is independent of Src.PLoS One. 2009 Nov 18;4(11):e7886. doi: 10.1371/journal.pone.0007886. PLoS One. 2009. PMID: 19924282 Free PMC article.
References
-
- Ai HW, Hazelwood KL, Davidson MW, Campbell RE. Fluorescent protein FRET pairs for ratiometric imaging of dual biosensors. Nat Methods. 2008;5:401–403. - PubMed
-
- Ai HW, Shaner NC, Cheng Z, Tsien RY, Campbell RE. Exploration of new chromophore structures leads to the identification of improved blue fluorescent proteins. Biochemistry. 2007;46:5904–5910. - PubMed
Publication types
MeSH terms
Grants and funding
LinkOut - more resources
Full Text Sources
Miscellaneous
