

TGF-beta and IL-10 production by HIV-specific CD8+ T cells is regulated by CTLA-4 signaling on CD4+ T cells
- PMID: 20016783
- PMCID: PMC2791208
- DOI: 10.1371/journal.pone.0008194
TGF-beta and IL-10 production by HIV-specific CD8+ T cells is regulated by CTLA-4 signaling on CD4+ T cells
Abstract
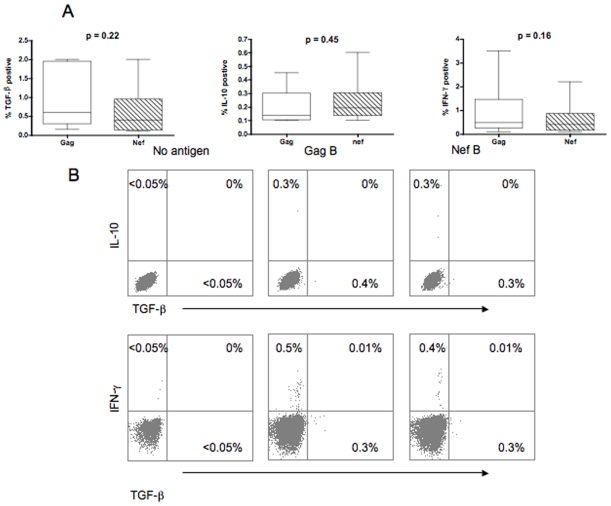
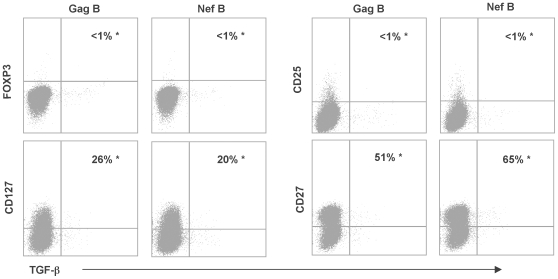
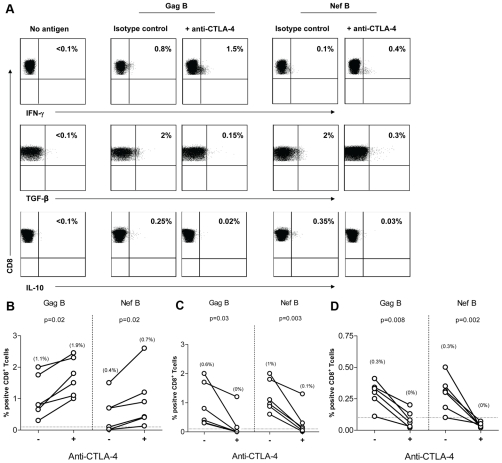
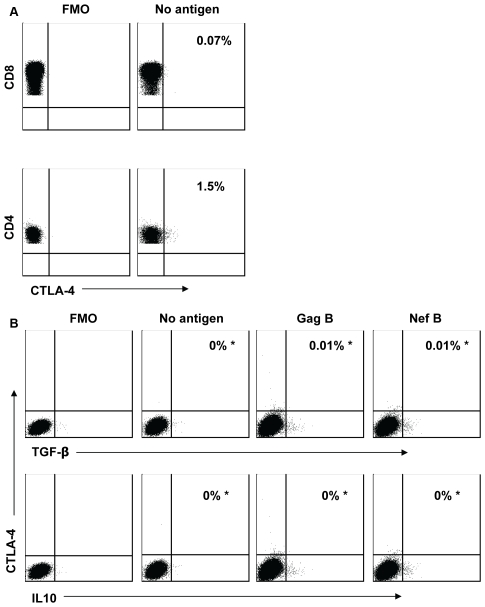
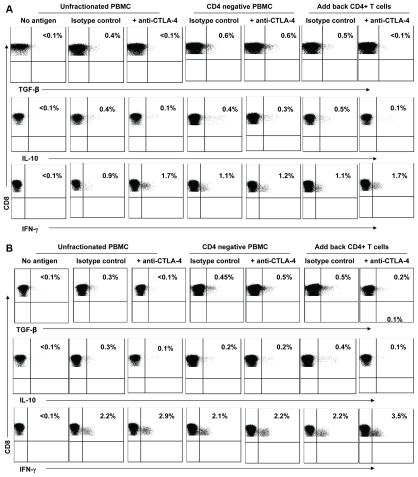
Immune dysregulation in HIV-1 infection is associated with increased expression of inhibitory molecules such as CTLA-4, TGF-beta, and IL-10. In this study we examined one potential mechanism for regulating TGF-beta and IL-10 expression by HIV-specific suppressor CD8+ T cells. No overlap between TGF-beta, IL-10, and IFN-gamma cytokine production by HIV-specific CD8+ T cells was observed. TGF-beta positive and IL-10 positive cells were FOXP3 negative, CD25 negative, and displayed a heterogeneous surface expression of CD127. TGF-beta and IL-10 positive CD8+ T cells did not express CTLA-4. Nevertheless, CTLA-4 blockade resulted in a significant decrease in HIV-specific TGF-beta positive and IL-10 positive CD8+ T cell responses, and a concomitant increase in HIV-specific IFN-gamma positive CD8+ T cell responses. Depletion of CD4+ T cells abrogated the impact of CTLA-4 on HIV-specific TGF-beta positive and IL-10 positive CD8+ T cells. Our study suggests that CTLA-4 Signaling on CD4+ T cells regulates the inhibitory functions of the HIV-specific suppressor CD8+ T cells.
Conflict of interest statement
Figures
Similar articles
-
HIV-specific TGF-beta-positive CD4+ T cells do not express regulatory surface markers and are regulated by CTLA-4.AIDS Res Hum Retroviruses. 2010 Mar;26(3):329-37. doi: 10.1089/aid.2009.0149. AIDS Res Hum Retroviruses. 2010. PMID: 20433405 Free PMC article.
-
Inhibitory molecules that regulate expansion and restoration of HCV-specific CD4+ T cells in patients with chronic infection.Gastroenterology. 2011 Oct;141(4):1422-31, 1431.e1-6. doi: 10.1053/j.gastro.2011.07.004. Epub 2011 Jul 18. Gastroenterology. 2011. PMID: 21763239
-
Level of double negative T cells, which produce TGF-β and IL-10, predicts CD8 T-cell activation in primary HIV-1 infection.AIDS. 2012 Jan 14;26(2):139-48. doi: 10.1097/QAD.0b013e32834e1484. AIDS. 2012. PMID: 22045342
-
TGF-β: guardian of T cell function.J Immunol. 2013 Oct 15;191(8):3973-9. doi: 10.4049/jimmunol.1301843. J Immunol. 2013. PMID: 24098055 Free PMC article. Review.
-
CD4+CD8+ double-positive T cells in immune disorders and cancer: Prospects and hurdles in immunotherapy.Autoimmun Rev. 2025 Feb 28;24(3):103757. doi: 10.1016/j.autrev.2025.103757. Epub 2025 Jan 22. Autoimmun Rev. 2025. PMID: 39855286 Review.
Cited by
-
Molecular signatures of T-cell inhibition in HIV-1 infection.Retrovirology. 2013 Mar 20;10:31. doi: 10.1186/1742-4690-10-31. Retrovirology. 2013. PMID: 23514593 Free PMC article. Review.
-
Expression of programmed cell death protein 1 and T-cell immunoglobulin- and mucin-domain-containing molecule-3 on peripheral blood CD4+CD8+ double positive T cells in patients with chronic hepatitis C virus infection and in subjects who spontaneously cleared the virus.J Viral Hepat. 2019 Aug;26(8):942-950. doi: 10.1111/jvh.13108. Epub 2019 Apr 29. J Viral Hepat. 2019. PMID: 30972915 Free PMC article.
-
IL-10-Secreting CD8+ T Cells Specific for Human Cytomegalovirus (HCMV): Generation, Maintenance and Phenotype.Pathogens. 2022 Dec 13;11(12):1530. doi: 10.3390/pathogens11121530. Pathogens. 2022. PMID: 36558866 Free PMC article.
-
HIV-1 proteins gp120 and tat induce the epithelial-mesenchymal transition in oral and genital mucosal epithelial cells.PLoS One. 2019 Dec 23;14(12):e0226343. doi: 10.1371/journal.pone.0226343. eCollection 2019. PLoS One. 2019. PMID: 31869348 Free PMC article.
-
Viable and Heat-Killed Probiotic Strains Improve Oral Immunity by Elevating the IgA Concentration in the Oral Mucosa.Curr Microbiol. 2021 Sep;78(9):3541-3549. doi: 10.1007/s00284-021-02569-8. Epub 2021 Aug 3. Curr Microbiol. 2021. PMID: 34345965 Free PMC article. Clinical Trial.
References
-
- Scotto L, Naiyer AJ, Galluzzo S, Rossi P, Manavalan JS, et al. Overlap between molecular markers expressed by naturally occurring CD4+CD25+ regulatory T cells and antigen specific CD4+CD25+ and CD8+CD28- T suppressor cells. Hum Immunol. 2004;65:1297–306. - PubMed
-
- Elrefaei M, Ventura FL, Baker CA, Clark R, Bangsberg DR, et al. HIV-specific IL-10-positive CD8+ T cells suppress cytolysis and IL-2 production by CD8+ T cells. J Immunol. 2007;178:3265–71. - PubMed
-
- Baecher-Allan C, Brown JA, Freeman GJ, Hafler DA. CD4+CD25high regulatory cells in human peripheral blood. J Immunol. 2001;167:1245–53. - PubMed
-
- Cosmi L, Liotta F, Lazzeri E, Francalanci M, Angeli R, et al. Human CD8+CD25+ thymocytes share phenotypic and functional features with CD4+CD25+ regulatory thymocytes. Blood. 2003;102:4107–14. - PubMed
Publication types
MeSH terms
Substances
Grants and funding
LinkOut - more resources
Full Text Sources
Other Literature Sources
Research Materials
