Voltage-dependent modulation of cardiac ryanodine receptors (RyR2) by protamine
- PMID: 20016815
- PMCID: PMC2789381
- DOI: 10.1371/journal.pone.0008315
Voltage-dependent modulation of cardiac ryanodine receptors (RyR2) by protamine
Abstract
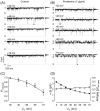
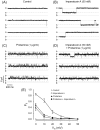
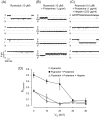
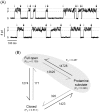
It has been reported that protamine (>10 microg/ml) blocks single skeletal RyR1 channels and inhibits RyR1-mediated Ca2+ release from sarcoplasmic reticulum microsomes. We extended these studies to cardiac RyR2 reconstituted into planar lipid bilayers. We found that protamine (0.02-20 microg/ml) added to the cytosolic surface of fully activated RyR2 affected channel activity in a voltage-dependent manner. At membrane voltage (V(m); SR lumen-cytosol) = 0 mV, protamine induced conductance transitions to several intermediate states (substates) as well as full block of RyR2. At V(m)>10 mV, the substate with the highest level of conductance was predominant. Increasing V(m) from 0 to +80 mV, decreased the number of transitions and residence of the channel in this substate. The drop in current amplitude (full opening to substate) had the same magnitude at 0 and +80 mV despite the approximately 3-fold increase in amplitude of the full opening. This is more similar to rectification of channel conductance induced by other polycations than to the action of selective conductance modifiers (ryanoids, imperatoxin). A distinctive effect of protamine (which might be shared with polylysines and histones but not with non-peptidic polycations) is the activation of RyR2 in the presence of nanomolar cytosolic Ca2+ and millimolar Mg2+ levels. Our results suggest that RyRs would be subject to dual modulation (activation and block) by polycationic domains of neighboring proteins via electrostatic interactions. Understanding these interactions could be important as such anomalies may be associated with the increased RyR2-mediated Ca2+ leak observed in cardiac diseases.
Conflict of interest statement
Figures


Similar articles
-
Imperatoxin A induces subconductance states in Ca2+ release channels (ryanodine receptors) of cardiac and skeletal muscle.J Gen Physiol. 1998 May;111(5):679-90. doi: 10.1085/jgp.111.5.679. J Gen Physiol. 1998. PMID: 9565405 Free PMC article.
-
Ryanoids and imperatoxin affect the modulation of cardiac ryanodine receptors by dihydropyridine receptor Peptide A.Biochim Biophys Acta. 2008 Nov;1778(11):2469-79. doi: 10.1016/j.bbamem.2008.07.024. Epub 2008 Aug 3. Biochim Biophys Acta. 2008. PMID: 18722342 Free PMC article.
-
Maurocalcine interacts with the cardiac ryanodine receptor without inducing channel modification.Biochem J. 2007 Sep 1;406(2):309-15. doi: 10.1042/BJ20070453. Biochem J. 2007. PMID: 17537000 Free PMC article.
-
Ca2+ stores regulate ryanodine receptor Ca2+ release channels via luminal and cytosolic Ca2+ sites.Clin Exp Pharmacol Physiol. 2007 Sep;34(9):889-96. doi: 10.1111/j.1440-1681.2007.04708.x. Clin Exp Pharmacol Physiol. 2007. PMID: 17645636 Review.
-
Molecular regulation of cardiac ryanodine receptor ion channel.Cell Calcium. 2004 Jun;35(6):621-8. doi: 10.1016/j.ceca.2004.01.015. Cell Calcium. 2004. PMID: 15110152 Review.
Cited by
-
Association of postoperative atrial fibrillation with higher dosing ratios of protamine-to-heparin.J Extra Corpor Technol. 2023 Mar 24;55(1):23-29. doi: 10.1051/ject/2023003. eCollection 2023 Mar. J Extra Corpor Technol. 2023. PMID: 37034101 Free PMC article.
-
Ethanol extract of Lycopus lucidus elicits positive inotropic effect via activation of Ca2+ entry and Ca2+ release in beating rabbit atria.J Med Food. 2013 Jul;16(7):633-40. doi: 10.1089/jmf.2012.2487. J Med Food. 2013. PMID: 23875903 Free PMC article.
-
Coupled gating of skeletal muscle ryanodine receptors is modulated by Ca2+, Mg2+, and ATP.Am J Physiol Cell Physiol. 2012 Sep 15;303(6):C682-97. doi: 10.1152/ajpcell.00150.2012. Epub 2012 Jul 11. Am J Physiol Cell Physiol. 2012. PMID: 22785120 Free PMC article.
-
Assessment of the Neuroprotective Effects of Arginine-Rich Protamine Peptides, Poly-Arginine Peptides (R12-Cyclic, R22) and Arginine-Tryptophan-Containing Peptides Following In Vitro Excitotoxicity and/or Permanent Middle Cerebral Artery Occlusion in Rats.Neuromolecular Med. 2017 Sep;19(2-3):271-285. doi: 10.1007/s12017-017-8441-2. Epub 2017 May 18. Neuromolecular Med. 2017. PMID: 28523591
References
-
- Fill M, Copello JA. Ryanodine receptor calcium release channels. Physiol Rev. 2002;82:893–922. - PubMed
-
- Rios E, Stern MD. Calcium in close quarters: microdomain feedback in excitation-contraction coupling and other cell biological phenomena. Annu Rev Biophys Biomol Struct. 1997;26:47–82. - PubMed
-
- Sitsapesan R, Williams AJ. London, UK: Imperial College Press; 1998. The Structure and Function of Ryanodine Receptors.
-
- Bers DM. Dordrecht, The Netherlands: Kluwer Academic Press; 2001. Excitation-Contraction Coupling and Cardiac Contractile Force.
Publication types
MeSH terms
Substances
Grants and funding
LinkOut - more resources
Full Text Sources
Research Materials
Miscellaneous

