

Quantifying the extent of North American mammal extinction relative to the pre-anthropogenic baseline
- PMID: 20016820
- PMCID: PMC2789409
- DOI: 10.1371/journal.pone.0008331
Quantifying the extent of North American mammal extinction relative to the pre-anthropogenic baseline
Abstract
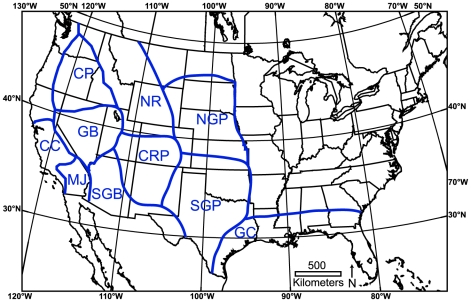
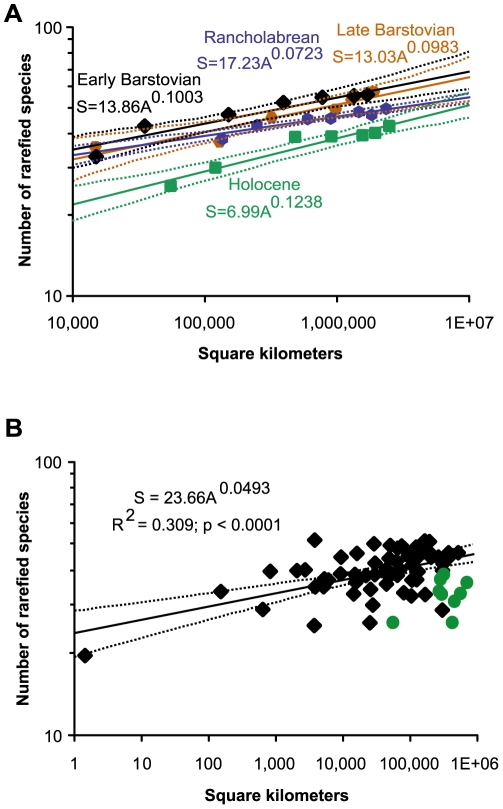
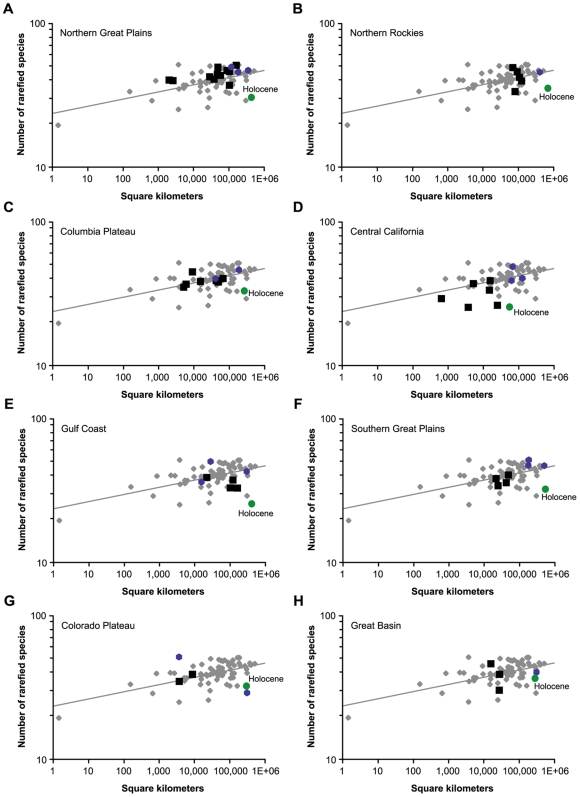
Earth has experienced five major extinction events in the past 450 million years. Many scientists suggest we are now witnessing a sixth, driven by human impacts. However, it has been difficult to quantify the real extent of the current extinction episode, either for a given taxonomic group at the continental scale or for the worldwide biota, largely because comparisons of pre-anthropogenic and anthropogenic biodiversity baselines have been unavailable. Here, we compute those baselines for mammals of temperate North America, using a sampling-standardized rich fossil record to reconstruct species-area relationships for a series of time slices ranging from 30 million to 500 years ago. We show that shortly after humans first arrived in North America, mammalian diversity dropped to become at least 15%-42% too low compared to the "normal" diversity baseline that had existed for millions of years. While the Holocene reduction in North American mammal diversity has long been recognized qualitatively, our results provide a quantitative measure that clarifies how significant the diversity reduction actually was. If mass extinctions are defined as loss of at least 75% of species on a global scale, our data suggest that North American mammals had already progressed one-fifth to more than halfway (depending on biogeographic province) towards that benchmark, even before industrialized society began to affect them. Data currently are not available to make similar quantitative estimates for other continents, but qualitative declines in Holocene mammal diversity are also widely recognized in South America, Eurasia, and Australia. Extending our methodology to mammals in these areas, as well as to other taxa where possible, would provide a reasonable way to assess the magnitude of global extinction, the biodiversity impact of extinctions of currently threatened species, and the efficacy of conservation efforts into the future.
Conflict of interest statement
Figures
References
-
- Myers N. New York: Pergamon Press; 1979. The Sinking Ark.307
-
- Leakey RC, Lewin R. New York: Anchor Books; 1995. The Sixth Extinction: Patterns of Life and the Future of Humankind.271
-
- Rosenzweig ML. New York: Oxford University Press; 2003. Win-Win Ecology: How Earth's Species Can Survive in the Midst of Human Enterprise.211
Publication types
MeSH terms
LinkOut - more resources
Full Text Sources
Other Literature Sources
Miscellaneous
