

The SRI24 multichannel atlas of normal adult human brain structure
- PMID: 20017133
- PMCID: PMC2915788
- DOI: 10.1002/hbm.20906
The SRI24 multichannel atlas of normal adult human brain structure
Abstract
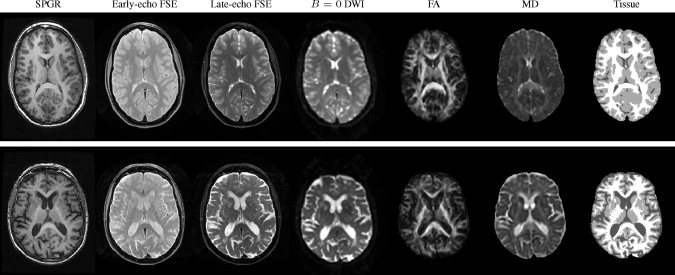
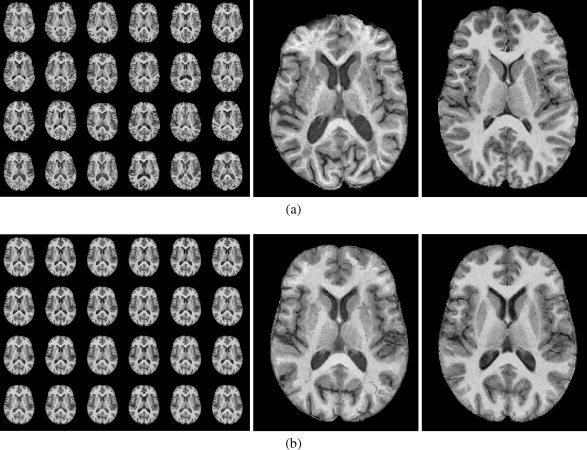
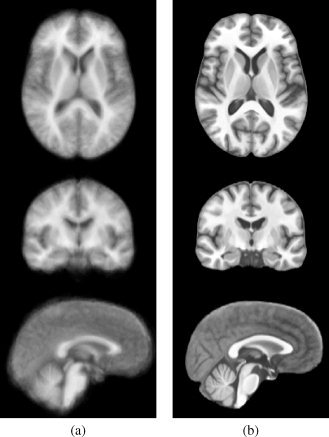
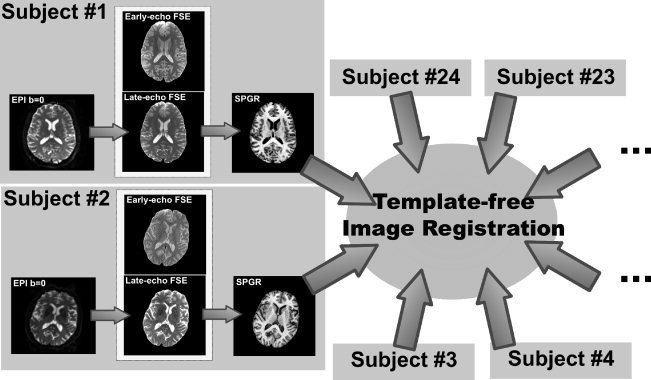
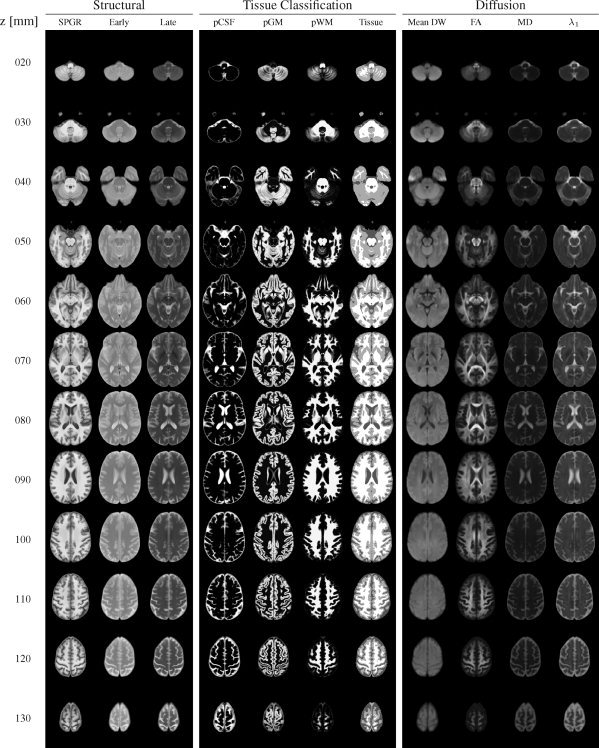
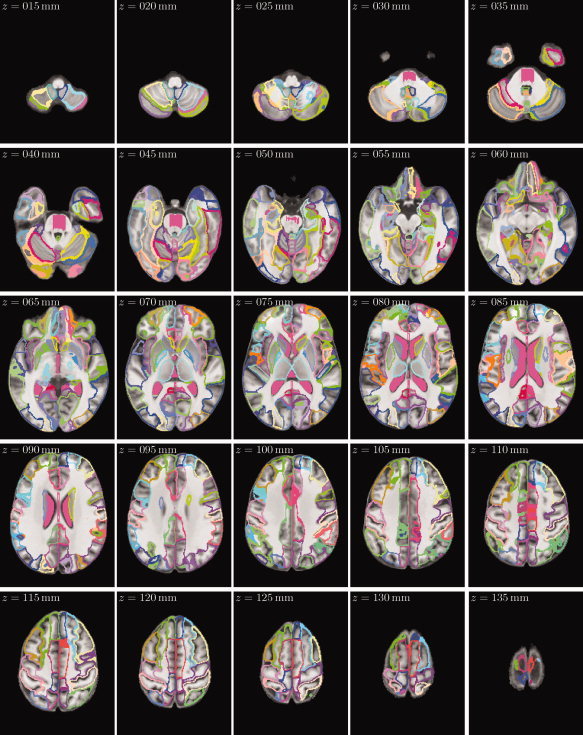
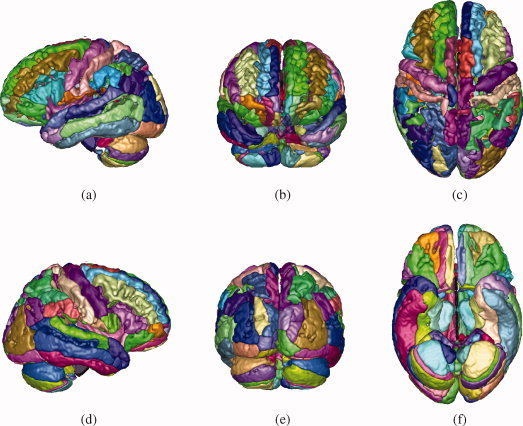
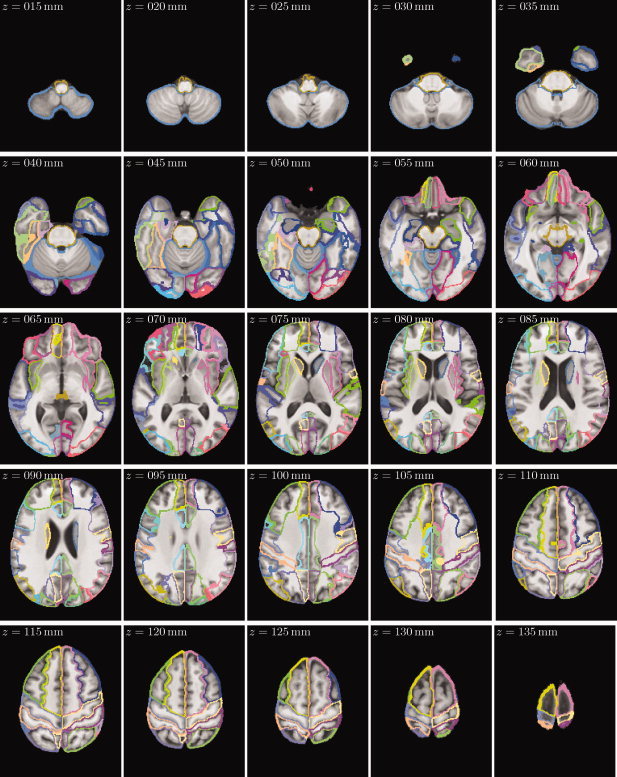
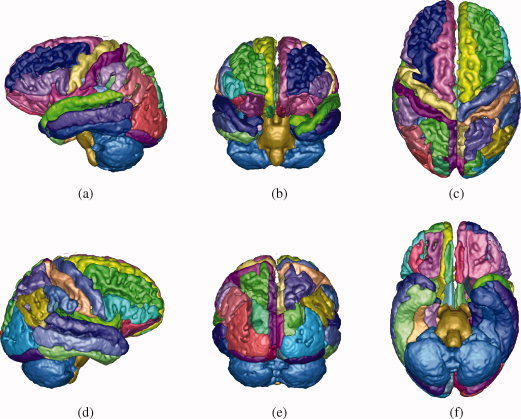
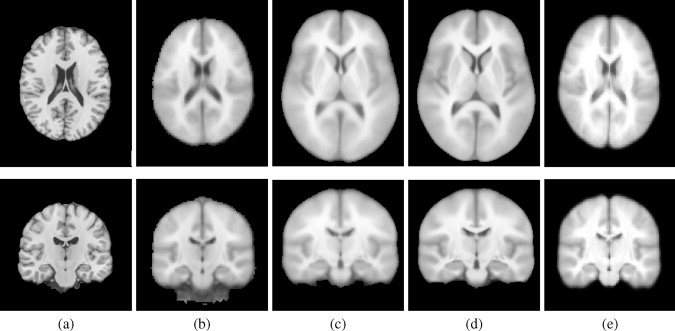
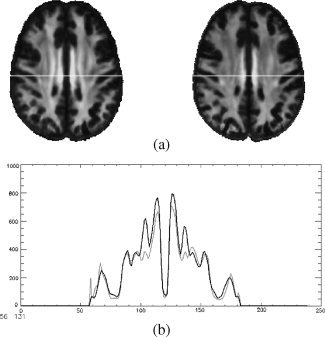
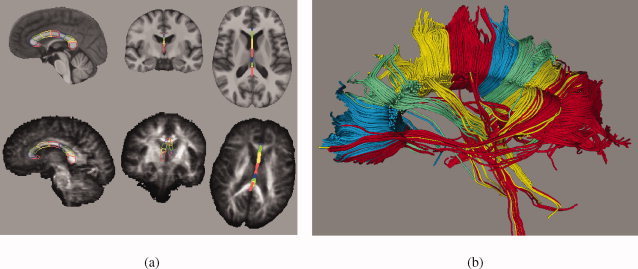
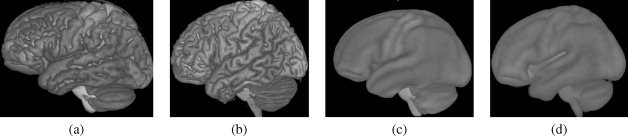
This article describes the SRI24 atlas, a new standard reference system of normal human brain anatomy, that was created using template-free population registration of high-resolution magnetic resonance images acquired at 3T in a group of 24 normal control subjects. The atlas comprises anatomical channels (T1, T2, and proton density weighted), diffusion-related channels (fractional anisotropy, mean diffusivity, longitudinal diffusivity, mean diffusion-weighted image), tissue channels (CSF probability, gray matter probability, white matter probability, tissue labels), and two cortical parcellation maps. The SRI24 atlas enables multichannel atlas-to-subject image registration. It is uniquely versatile in that it is equally suited for the two fundamentally different atlas applications: label propagation and spatial normalization. Label propagation, herein demonstrated using diffusion tensor image fiber tracking, is enabled by the increased sharpness of the SRI24 atlas compared with other available atlases. Spatial normalization, herein demonstrated using data from a young-old group comparison study, is enabled by its unbiased average population shape property. For both propagation and normalization, we also report the results of quantitative comparisons with seven other published atlases: Colin27, MNI152, ICBM452 (warp5 and air12), and LPBA40 (SPM5, FLIRT, AIR). Our results suggest that the SRI24 atlas, although based on 3T MR data, allows equally accurate spatial normalization of data acquired at 1.5T as the comparison atlases, all of which are based on 1.5T data. Furthermore, the SRI24 atlas is as suitable for label propagation as the comparison atlases and detailed enough to allow delineation of anatomical structures for this purpose directly in the atlas.
Figures
Similar articles
-
The SRI24 Multi-Channel Brain Atlas: Construction and Applications.Proc SPIE Int Soc Opt Eng. 2008;6914:691409. doi: 10.1117/12.770441. Proc SPIE Int Soc Opt Eng. 2008. PMID: 19183706 Free PMC article.
-
The VALiDATe29 MRI Based Multi-Channel Atlas of the Squirrel Monkey Brain.Neuroinformatics. 2017 Oct;15(4):321-331. doi: 10.1007/s12021-017-9334-0. Neuroinformatics. 2017. PMID: 28748393 Free PMC article.
-
Human brain atlas for automated region of interest selection in quantitative susceptibility mapping: application to determine iron content in deep gray matter structures.Neuroimage. 2013 Nov 15;82:449-69. doi: 10.1016/j.neuroimage.2013.05.127. Epub 2013 Jun 12. Neuroimage. 2013. PMID: 23769915 Free PMC article.
-
A review of atlas-based segmentation for magnetic resonance brain images.Comput Methods Programs Biomed. 2011 Dec;104(3):e158-77. doi: 10.1016/j.cmpb.2011.07.015. Epub 2011 Aug 25. Comput Methods Programs Biomed. 2011. PMID: 21871688 Review.
-
Diffusion-weighted MR of the brain: methodology and clinical application.Radiol Med. 2005 Mar;109(3):155-97. Radiol Med. 2005. PMID: 15775887 Review. English, Italian.
Cited by
-
Differential compromise of prospective and retrospective metamemory monitoring and their dissociable structural brain correlates.Cortex. 2016 Aug;81:192-202. doi: 10.1016/j.cortex.2016.05.002. Epub 2016 May 15. Cortex. 2016. PMID: 27244277 Free PMC article.
-
Overall survival prediction in glioblastoma patients using structural magnetic resonance imaging (MRI): advanced radiomic features may compensate for lack of advanced MRI modalities.J Med Imaging (Bellingham). 2020 May;7(3):031505. doi: 10.1117/1.JMI.7.3.031505. Epub 2020 Jun 9. J Med Imaging (Bellingham). 2020. PMID: 32566694 Free PMC article.
-
Human-to-monkey transfer learning identifies the frontal white matter as a key determinant for predicting monkey brain age.Front Aging Neurosci. 2023 Nov 1;15:1249415. doi: 10.3389/fnagi.2023.1249415. eCollection 2023. Front Aging Neurosci. 2023. PMID: 38020785 Free PMC article.
-
Variation in longitudinal trajectories of regional brain volumes of healthy men and women (ages 10 to 85 years) measured with atlas-based parcellation of MRI.Neuroimage. 2013 Jan 15;65:176-93. doi: 10.1016/j.neuroimage.2012.10.008. Epub 2012 Oct 12. Neuroimage. 2013. PMID: 23063452 Free PMC article.
-
Radiogenomic classification for MGMT promoter methylation status using multi-omics fused feature space for least invasive diagnosis through mpMRI scans.Sci Rep. 2023 Feb 25;13(1):3291. doi: 10.1038/s41598-023-30309-4. Sci Rep. 2023. PMID: 36841898 Free PMC article.
References
-
- Ashburner J, Friston KJ ( 2000): Voxel‐based morphometry—The methods. Neuroimage 11: 805–821. - PubMed
-
- Balci SK, Golland P, Shenton M, Wells WM ( 2007): Free‐form B‐spline deformation model for groupwise registration. In: MICCAI 2007 Workshop Statistical Registration: Pair‐wise and Group‐wise Alignment and Atlas Formation. pp 23–30.
-
- Basser PJ, Pierpaoli C ( 1996): Microstructural and physiological features of tissues elucidated by quantitative‐diffusion‐tensor MRI. J Magn Reson B 111: 209–219. - PubMed
-
- Bhatia K, Hajnal J, Puri B, Edwards A, Rueckert D ( 2004): Consistent groupwise nonrigid registration for atlas construction In: IEEE International Symposium on Biomedical Imaging: Nano to Macro, Piscataway, NJ: IEEE Press, Vol. 1 pp 908–911.
Publication types
MeSH terms
Grants and funding
LinkOut - more resources
Full Text Sources
Other Literature Sources
Medical
