

Determination of side-chain-rotamer and side-chain and backbone virtual-bond-stretching potentials of mean force from AM1 energy surfaces of terminally-blocked amino-acid residues, for coarse-grained simulations of protein structure and folding. II. Results, comparison with statistical potentials, and implementation in the UNRES force field
- PMID: 20017135
- PMCID: PMC2849738
- DOI: 10.1002/jcc.21402
Determination of side-chain-rotamer and side-chain and backbone virtual-bond-stretching potentials of mean force from AM1 energy surfaces of terminally-blocked amino-acid residues, for coarse-grained simulations of protein structure and folding. II. Results, comparison with statistical potentials, and implementation in the UNRES force field
Abstract
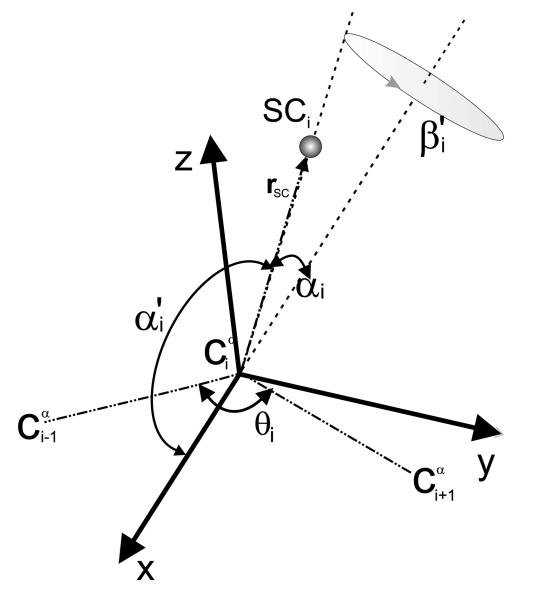
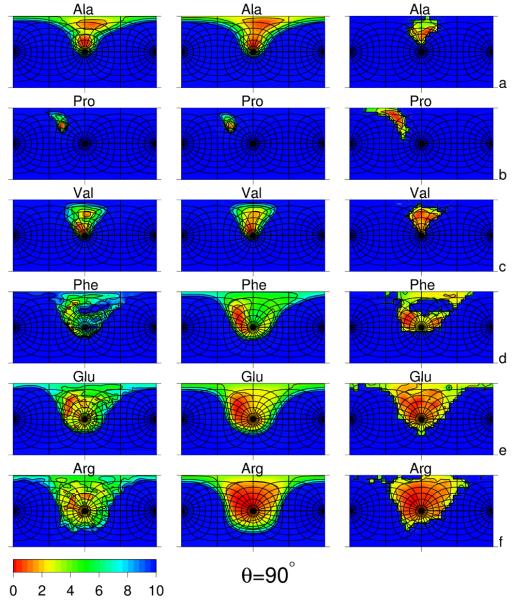
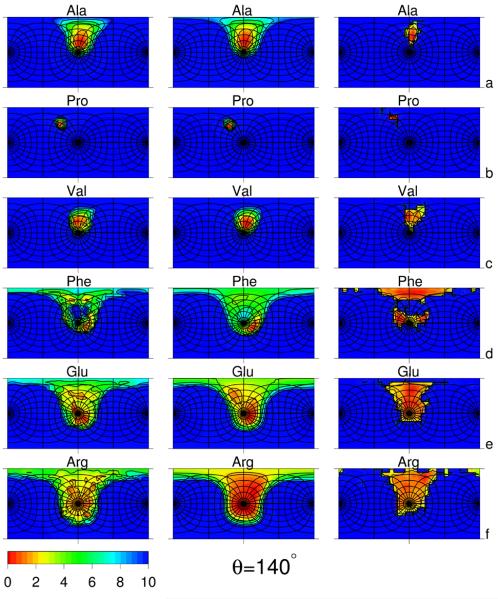
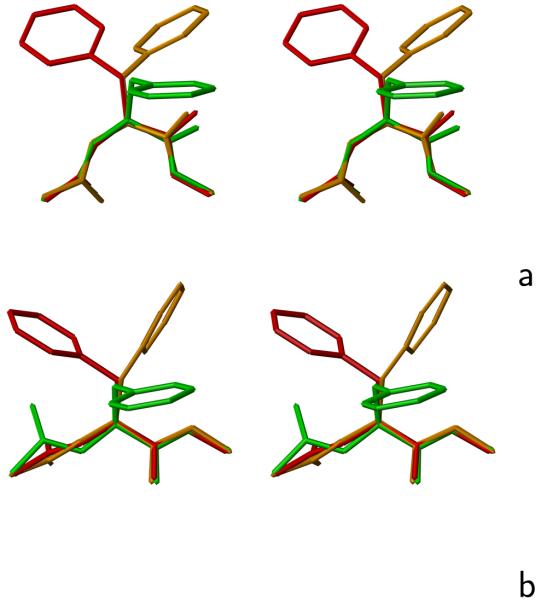
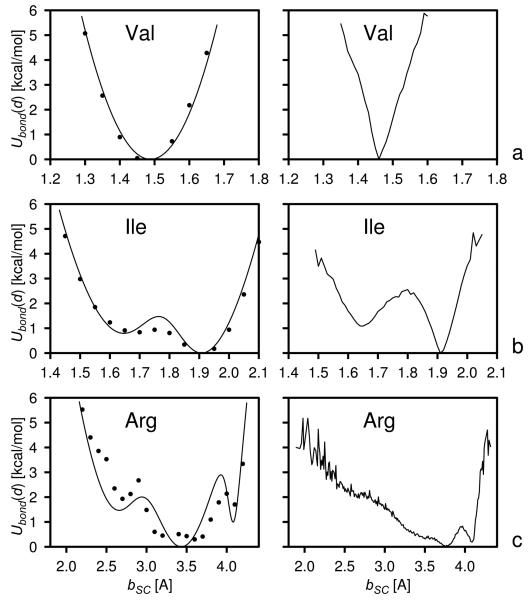
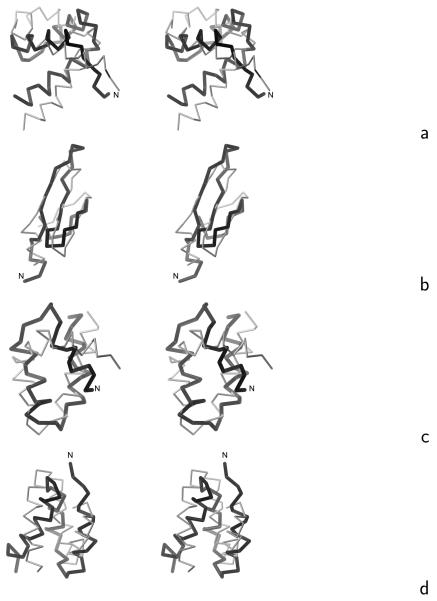
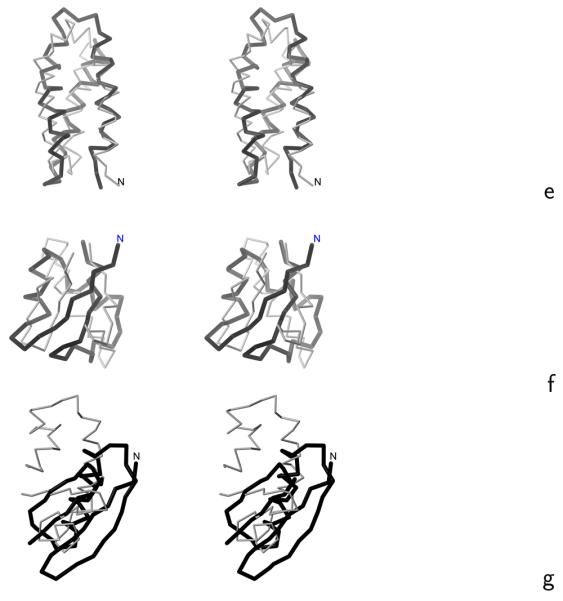
Using the harmonic-approximation approach of the accompanying article and AM1 energy surfaces of terminally blocked amino-acid residues, we determined physics-based side-chain rotamer potentials and the side-chain virtual-bond-deformation potentials of 19 natural amino-acid residues with side chains. The potentials were approximated by analytical formulas and implemented in the UNRES mesoscopic dynamics program. For comparison, the corresponding statistical potentials were determined from 19,682 high-resolution protein structures. The low free-energy region of both the AM1-derived and the statistical potentials is determined by the valence geometry and the L-chirality, and its size increases with side-chain flexibility and decreases with increasing virtual-bond-angle theta. The differences between the free energies of rotamers are greater for the AM1-derived potentials compared with the statistical potentials and, for alanine and other residues with small side chains, a region corresponding to the C(ax)(7) conformation has remarkably low free-energy for the AM1-derived potentials, as opposed to the statistical potentials. These differences probably result from the interactions between neighboring residues and indicate the need for introduction of cooperative terms accounting for the coupling between side-chain rotamer and backbone interactions. Both AM1-derived and statistical virtual-bond-deformation potentials are multimodal for flexible side chains and are topologically similar; however, the regions of minima of the statistical potentials are much narrower, which probably results from imposing restraints in structure determination. The force field with the new potentials was preliminarily optimized using the FBP WW domain (1E0L) and the engrailed homeodomain (1ENH) as training proteins and assessed to be reasonably transferable.
2009 Wiley Periodicals, Inc.
Figures
Similar articles
-
Physics-based potentials for the coupling between backbone- and side-chain-local conformational states in the UNited RESidue (UNRES) force field for protein simulations.J Chem Theory Comput. 2015 Feb 10;11(2):817-31. doi: 10.1021/ct500736a. J Chem Theory Comput. 2015. PMID: 25691834 Free PMC article.
-
Determination of side-chain-rotamer and side-chain and backbone virtual-bond-stretching potentials of mean force from AM1 energy surfaces of terminally-blocked amino-acid residues, for coarse-grained simulations of protein structure and folding. I. The method.J Comput Chem. 2010 Apr 30;31(6):1143-53. doi: 10.1002/jcc.21399. J Comput Chem. 2010. PMID: 20073062 Free PMC article.
-
Revised Backbone-Virtual-Bond-Angle Potentials to Treat the l- and d-Amino Acid Residues in the Coarse-Grained United Residue (UNRES) Force Field.J Chem Theory Comput. 2014 May 13;10(5):2194-2203. doi: 10.1021/ct500119r. Epub 2014 Apr 15. J Chem Theory Comput. 2014. PMID: 24839411 Free PMC article.
-
Coarse-grained force field: general folding theory.Phys Chem Chem Phys. 2011 Oct 14;13(38):16890-901. doi: 10.1039/c1cp20752k. Epub 2011 Jun 3. Phys Chem Chem Phys. 2011. PMID: 21643583 Free PMC article. Review.
-
Rotamer Dynamics: Analysis of Rotamers in Molecular Dynamics Simulations of Proteins.Biophys J. 2019 Jun 4;116(11):2062-2072. doi: 10.1016/j.bpj.2019.04.017. Epub 2019 Apr 22. Biophys J. 2019. PMID: 31084902 Free PMC article. Review.
Cited by
-
Secondary Structure in Free and Assisted Modeling of Proteins with the Coarse-Grained UNRES Force Field.Methods Mol Biol. 2025;2867:19-41. doi: 10.1007/978-1-0716-4196-5_2. Methods Mol Biol. 2025. PMID: 39576573
-
Physics-based potentials for the coupling between backbone- and side-chain-local conformational states in the UNited RESidue (UNRES) force field for protein simulations.J Chem Theory Comput. 2015 Feb 10;11(2):817-31. doi: 10.1021/ct500736a. J Chem Theory Comput. 2015. PMID: 25691834 Free PMC article.
-
Investigation of protein folding by coarse-grained molecular dynamics with the UNRES force field.J Phys Chem A. 2010 Apr 8;114(13):4471-85. doi: 10.1021/jp9117776. J Phys Chem A. 2010. PMID: 20166738 Free PMC article.
-
Implementation of molecular dynamics and its extensions with the coarse-grained UNRES force field on massively parallel systems; towards millisecond-scale simulations of protein structure, dynamics, and thermodynamics.J Chem Theory Comput. 2010 Mar 9;6(3):890-909. doi: 10.1021/ct9004068. J Chem Theory Comput. 2010. PMID: 20305729 Free PMC article.
-
Kinks, loops, and protein folding, with protein A as an example.J Chem Phys. 2014 Jan 14;140(2):025101. doi: 10.1063/1.4855735. J Chem Phys. 2014. PMID: 24437917 Free PMC article.
References
-
- Stewart JJ. J. Comput.-Aided Molec. Design. 1990;4:1. - PubMed
-
- Kozłowska U, Liwo A, Scheraga HA. J. Phys.: Cond. Matter. 2007;19:285203.
Publication types
MeSH terms
Substances
Grants and funding
LinkOut - more resources
Full Text Sources
Miscellaneous
