. 2010 Feb 15;518(4):439-58.
doi: 10.1002/cne.22214.

Genetic dissection of dopaminergic and noradrenergic contributions to catecholaminergic tracts in early larval zebrafish

Affiliations
Free PMC article

Genetic dissection of dopaminergic and noradrenergic contributions to catecholaminergic tracts in early larval zebrafish

Edda Kastenhuber et al. J Comp Neurol. .
Free PMC article

Abstract

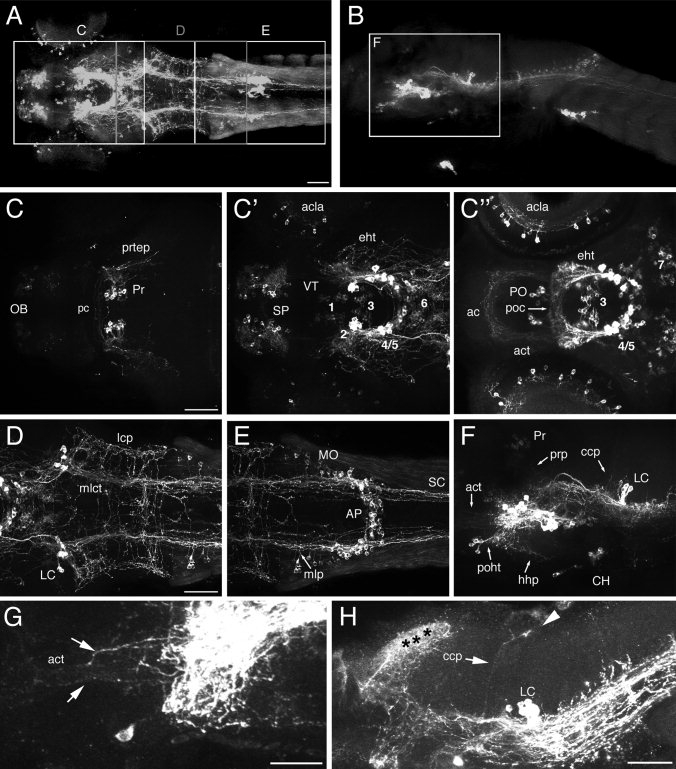
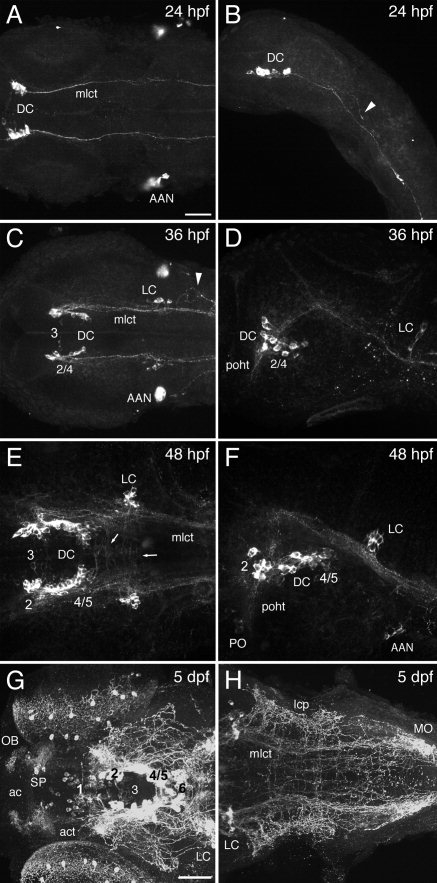
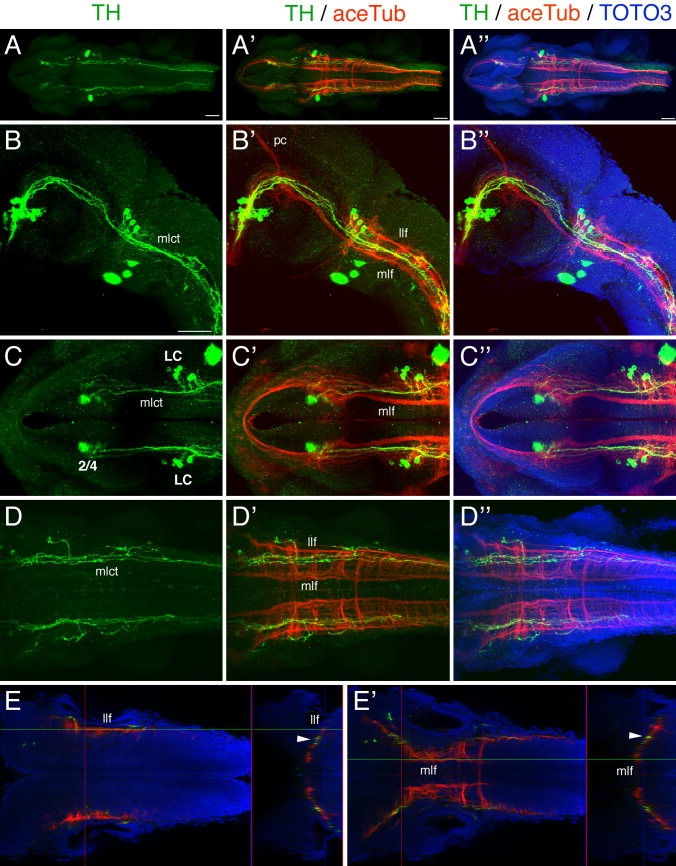
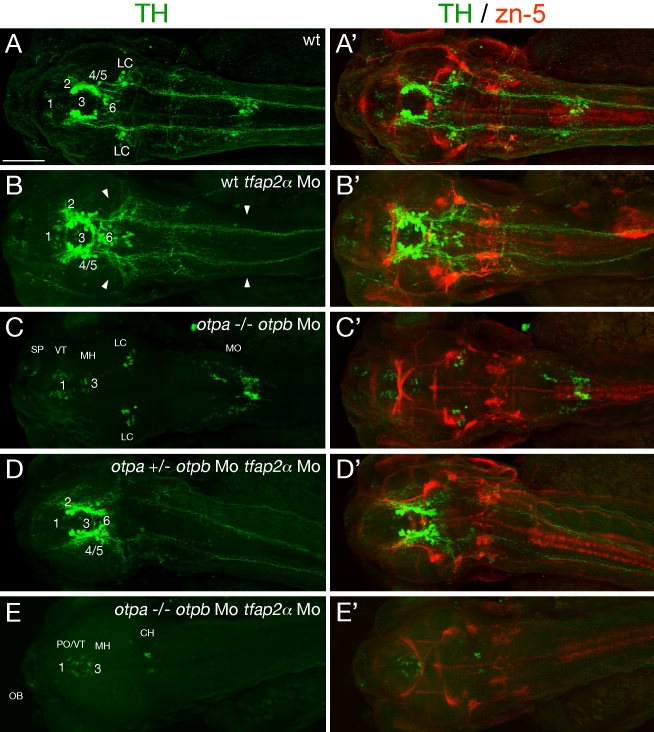
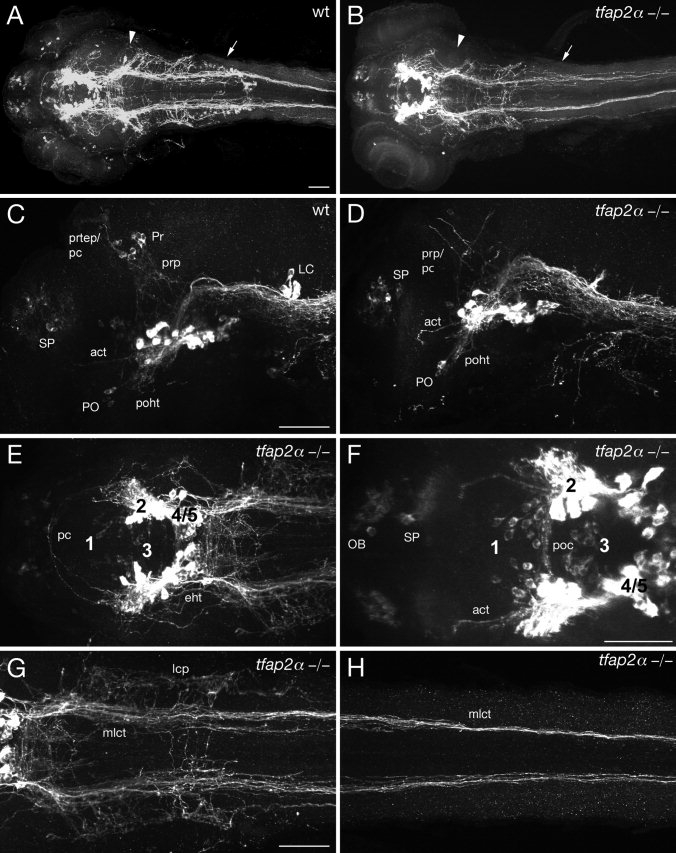
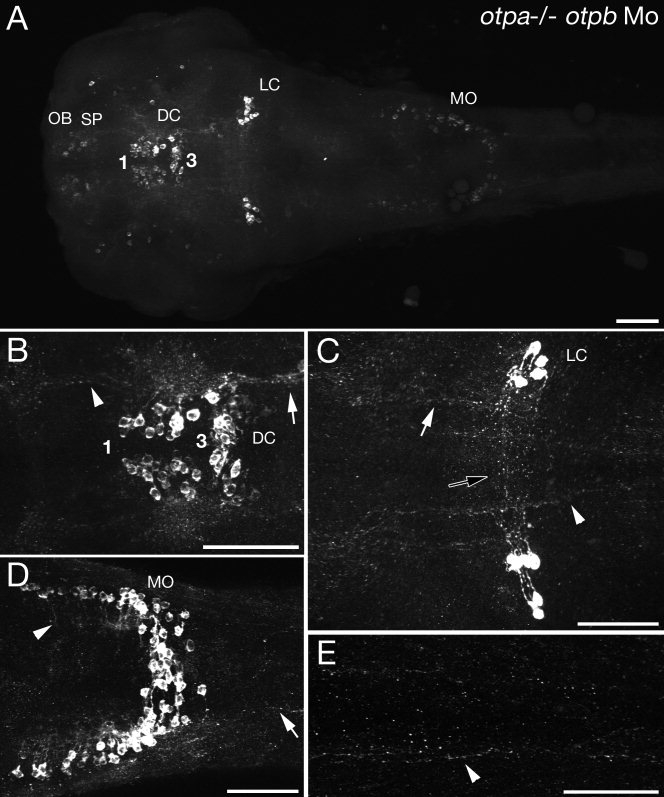
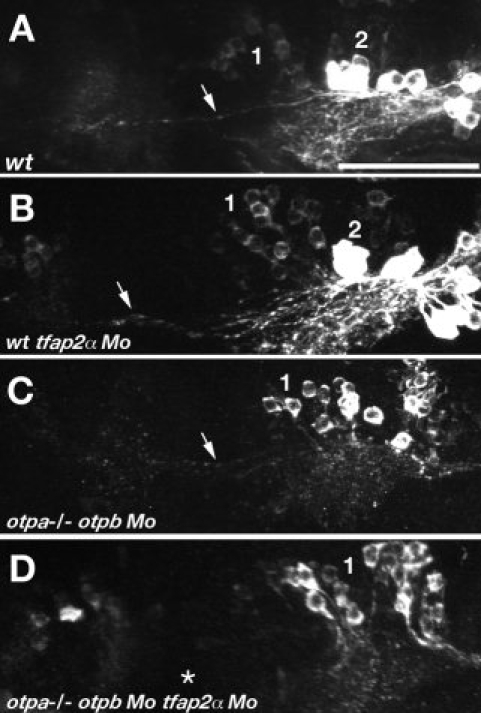
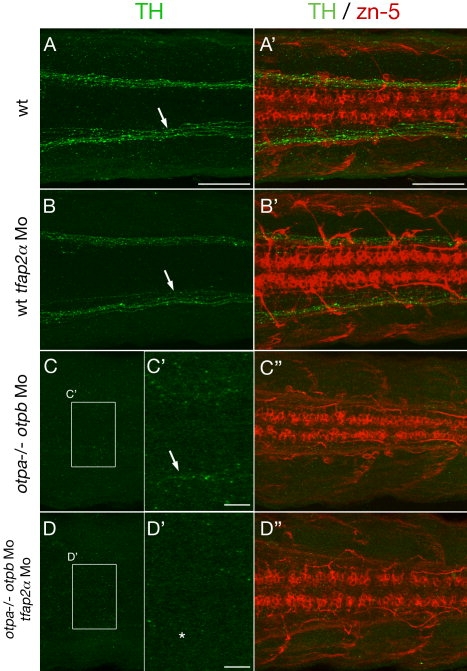
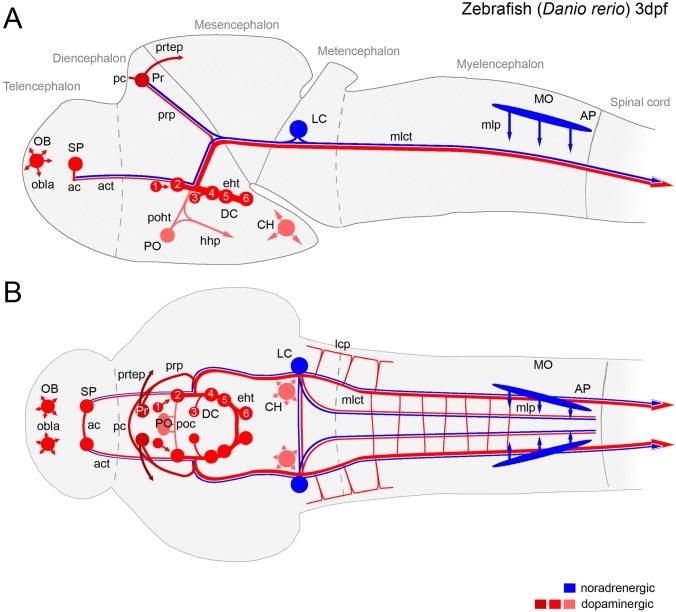
The catecholamines dopamine and noradrenaline provide some of the major neuromodulatory systems with far-ranging projections in the brain and spinal cord of vertebrates. However, development of these complex systems is only partially understood. Zebrafish provide an excellent model for genetic analysis of neuronal specification and axonal projections in vertebrates. Here, we analyze the ontogeny of the catecholaminergic projections in zebrafish embryos and larvae up to the fifth day of development and establish the basic scaffold of catecholaminergic connectivity. The earliest dopaminergic diencephalospinal projections do not navigate along the zebrafish primary neuron axonal scaffold but establish their own tracts at defined ventrolateral positions. By using genetic tools, we study quantitative and qualitative contributions of noradrenergic and defined dopaminergic groups to the catecholaminergic scaffold. Suppression of Tfap2a activity allows us to eliminate noradrenergic contributions, and depletion of Otp activity deletes mammalian A11-like Otp-dependent ventral diencephalic dopaminergic groups. This analysis reveals a predominant contribution of Otp-dependent dopaminergic neurons to diencephalospinal as well as hypothalamic catecholaminergic tracts. In contrast, noradrenergic projections make only a minor contribution to hindbrain and spinal catecholaminergic tracts. Furthermore, we can demonstrate that, in zebrafish larvae, ascending catecholaminergic projections to the telencephalon are generated exclusively by Otp-dependent diencephalic dopaminergic neurons as well as by hindbrain noradrenergic groups. Our data reveal the Otp-dependent A11-type dopaminergic neurons as the by far most prominent dopaminergic system in larval zebrafish. These findings are consistent with a hypothesis that Otp-dependent dopaminergic neurons establish the major modulatory system for somatomotor and somatosensory circuits in larval fish.


Figures

Figure 1
Figure 1
CA projections in 3-day-old wild-type zebrafish early larvae. Z-projections of confocal stacks of whole-mount anti-TH immunohistochemistry in 72 hpf (A–G) or 5 dpf (H) wild-type embryos are shown. Dorsal (A,C–E) and lateral (B,F–H) views, anterior to the left (A–H), dorsal at top (B,F–H). A: Z-projection (189 μm) showing a dorsal overview of TH immunoreactivity. Regions depicted in C–E are indicated by boxes. The faint signal in somites is nonspecific. B: Z-projection (105 μm) showing a lateral overview of TH immunoreactivity. The box illustrates the region depicted in F. C–C′′: Z-projections (65 μm, 90 μm, and 50 μm, respectively) of anterior brain regions going from dorsal (C) to ventral (C′′) showing THir circuitry in the tel- and diencephalon. C: Projections of the pretectal THir cluster are indicated. The olfactory bulb THir neurons project only locally. C′: THir tracts of the retina, ventral diencephalon, and subpallium. C′′: Ventral diencephalon including preoptic region and hypothalamus. Commissures and tracts containing THir fibers are labeled. D: Z-projection (125 μm) showing the most posterior groups in the diencephalon and the LC in the rhombencephalon. E: Z-projection (121 μm) of posterior rhombencephalon and spinal cord. F: Z-projection (105 μm) of lateral confocal stack of the larval brain. G: Z-projection of a lateral confocal stack showing the act (arrows point to axons belonging to the act). H: Z-projection of a lateral confocal stack demonstrating the ccp (arrow) projecting to the cerebellum (arrowhead). Asterisks indicate dense innervation of THir fibers in the tectum. The numbering of ventral diencephalic DA groups is according to Rink and Wullimann (2002a). For abbreviations see list. Scale bars = 50 μm in A (applies to A,B); 50 μm in C; 50 μm in D (applies to D–F); 10 μm in G; 20 μm in H.
Figure 2
Figure 2
Formation of CA projections during development. Z-projections of confocal stacks of whole-mount anti-TH immunohistochemistry in wild-type embryos are shown; dorsal (A,C,E,G) and lateral (B,D,F,H) views, anterior to the left. A: Dorsal z-projection of a 24 hpf embryo shows that mlct axons are the first THir projections. B: Lateral z-projection of an embryo at 24 hpf. The arrowhead indicates a growth cone of an outgrowing mlct axon. C,D: Z-projections of TH immunoreactivity in 36 hpf embryos. Noradrenergic LC neurons are forming, and lcp axons start to arborize in the lateral hindbrain (arrowhead). E: Dorsal z-projection of a 48-hpf embryo. The first transversal THir projections appear in the region between the mid–hindbrain border and the LC. F: Lateral z-projection of an embryo at 48 hpf. The poht between the DC and the preoptic region is detectable. G,H: Z-projections of 5-dpf free-swimming larvae. The AAN expresses th already as migratory precursors and later contributes to the carotid body, which detects changes in blood flow composition. The numbering of ventral diencephalic DA groups is according to Rink and Wullimann (2002a). For abbreviations see list. Scale bars = 50 μm in A (applies to A–F); 50 μm in G (applies to G,H).
Figure 3
Figure 3
Longitudinal diencephalospinal THir projections do not colocalize with the mlf or llf of the primary axonal scaffold. We utilized antiacetylated tubulin (aceTub) in combination with anti-TH immunohistochemistry to investigate whether CA descending tracts follow the main primary axonal scaffolds characterized in zebrafish. Wild-type embryos were analyzed at 36 hpf and z-projections of confocal stacks of whole-mount immunohistochemistry combined with TOTO3 nuclear counterstaining prepared. Dorsal (A,C–E) and lateral (B) views, anterior to the left. A–A′′: Z-projection showing a dorsal overview. B–B′′: Lateral z-projection of diencephalon to hindbrain region. C–C′′: Dorsal z-projection of the brain region from the telencephalon to anterior hindbrain. D–D′′: Dorsal z-projection of hindbrain and spinal cord. The mlct does not project along the mlf or llf of the primary axonal scaffold. E: Single confocal dorsal plane showing the location of the llf in the hindbrain. The scan in z-direction shown on the right side reveals that mlct axons (arrowhead) do not correlate with the llf. E′: Single confocal dorsal plane showing the position of the mlf in the hindbrain. The scan in z-direction shown on the right side reveals that the mlct (arrowhead) does not correlate with the mlf. The numbering of ventral diencephalic DA groups is according to Rink and Wullimann (2002a). For abbreviations see list. A magenta green copy of this figure is available as Supporting Information Figure 2. Scale bars = 50 μm in A; 50 μm in B (applies to B–E′).
Figure 4
Figure 4
The majority of THir projections emanate from Otp-dependent diencephalic dopaminergic neurons. The relative contribution of DA and NA was investigated by genetic elimination of hindbrain NA or Otp-dependent DA neurons. Axonal projections were analyzed using anti-TH immunohistochemistry for CA tracts and zn-5 immunohistochemistry as a control for potential effects on general axonal tracts. Z-projections of confocal stacks of whole-mount 72 hpf embryos are shown; dorsal views, anterior to the left (A–E). A,A′: CA circuitry of wild-type control embryos. B,B′: Wild-type embryos injected with tfap2α morpholino (Mo) lack noradrenergic LC and MO neurons (arrowheads). C,C′: Homozygous otpa–/– mutants injected with otpb Mo lack all Otp-dependent diencephalic DA neurons. D,D′: Heterozygous otpa+/– embryos coinjected with otpb and tfap2α Mo lack noradrenergic LC and MO neurons but still develop most DA neurons, revealing that double Mo injection does not affect axonogenesis in general. E,E′: Homozygous otpa–/– mutants coinjected with otpb and tfap2α Mo reveal the absence of brain NA and Otp-dependent DA neurons, whereas telencephalic, ventral thalamic, and medial hypothalamic DA neurons still form. Caudal hypothalamic CA neurons cannot consistently be detected at this stage (compare to C,D). A magenta green copy of this figure is available as Supporting Information Figure 3. The numbering of ventral diencephalic DA groups is according to Rink and Wullimann (2002a). For abbreviations see list. Scale bar = 100 μm.
Figure 5
Figure 5
Comparison of CA projections in wild-type embryos and tfap2αm819 mutant embryos. Genetic elimination of noradrenergic LC and MO projections reveals DA contribution to CA projections. Z-projections of confocal stacks of whole-mount anti-TH immunohistochemistry in 72-hpf embryos are shown. Dorsal (A,B,E–H) and lateral (C,D) views, anterior to the left. A,B: Dorsal overviews of wild-type (A) and tfap2α–/– mutant (B) embryos. The anatomical positions of the LC (arrowhead) and MO (arrow) are indicated. THir neurons of the LC and MO are not differentiated in tfap2α–/– mutants. C,D: Lateral overviews of wild-type (C) and tfap2α–/– (D) embryos. D: The THir pretectal cluster is missing in tfap2α–/– embryos, but THir projections from the diencephalon to the pretectum (pc/prp) are visible. Ascending DA tracts (act) are also present in tfap2α–/– mutants. E: Connectivity of diencephalic DA neurons in tfap2α–/– mutants, dorsal part. The THir part of the pc is present. F: Connectivity of diencephalic DA neurons in tfap2α–/– mutants, ventral part. The poc and act are shown. G: Hindbrain region of tfap2α–/– mutants. Although NA neurons do not differentiate, hindbrain axonal projections are present (compare with Fig. 1D). H: Spinal cord region of tfap2α–/– mutants. The mlct is comparable to that in wild-type embryos (see Fig. 1E). The numbering of ventral diencephalic DA groups is according to Rink and Wullimann (2002a). For abbreviations see list. Scale bars = 50 μm in A (applies to A,B); 50 μm in C (applies to C–E); 50 μm in F; 50 μm in G (applies to G,H).
Figure 6
Figure 6
Comparison of CA projections in wild-type embryos and embryos completely devoid of Otp-specified DA neurons. A–E: Activity of both otpa and otpb genes was eliminated by injection of 2 ng otpb morpholinos into otpam866 homozygous mutant embryos. Z-projections of confocal stacks of whole-mount anti-TH immunohistochemistry in 72-hpf embryos are shown; dorsal views, anterior to the left. A: Embryos deficient for all Otp activity do not develop posterior tubercular (groups 2 and 4) or lateral hypothalamic (groups 5 and 6) DA neuronal groups (for numbering of groups, see Fig. 9 and Supp. Info. Fig 1), whereas NA neurons (LC, MO) and Otp-independent DA neurons (OB, SP, PO, DC for ventral thalamic and medial as well as caudal hypothalamic groups) are present. The number of CA projections is drastically reduced. B: Axonal fibers are detectable in the diencephalon, including ascending projections to the telencephalon (arrowhead) and projections into the posterior hypothalamus (arrow). C: THir projections in the mid- and hindbrain: anterior mlct (white arrow), commissural (black arrow), and posterior mlct (arrowhead) projections in the region of the noradrenergic LC. D: In the MO, fine axonal projections take a medioventral route (arrowhead). A small number of very thin longitudinal projections can be detected in the hindbrain spinal cord, posterior to the MO NA neurons. E: THir longitudinal projections in the spinal cord (arrowhead). The numbering of ventral diencephalic DA groups is according to Rink and Wullimann (2002a). For abbreviations see list. Scale bars = 50 μm.
Figure 7
Figure 7
DA and NA contributions to the act. Genetic elimination of NA or Otp-dependent DA THir projections reveals ascending contributions. Z-projections of confocal stacks of whole-mount anti-TH immunohistochemistry in 72-hpf embryos are shown, dorsal views, anterior to the left (A–D). The act (arrows) axonal projections of wild-type embryos (A), wild-type embryos injected with tfap2α Mo (B), otpam866 mutant embryos injected with otpb Mo (C), and otpam866 mutant embryos coinjected with otpb and tfap2α Mo (D) were analyzed. tfap2α Mo-injected wild-type embryos (arrow in B) and otpb Mo-injected otpam866 mutant embryos (arrow in C) both have THir projections between the diencephalic cluster and subpallium. THir act axons are not detectable in otpam866 mutant embryos coinjected with otpb and tfap2α Mo (asterisk in D). The numbering of ventral diencephalic DA groups is according to Rink and Wullimann (2002a). Scale bar = 50 μm.
Figure 8
Figure 8
DA and NA contributions to longitudinal spinal THir tracts. Genetic elimination of NA or Otp-dependent DA THir projections reveals spinal CA contributions. Z-projections of confocal stacks of whole-mount anti-TH and zn-5 coimmunohistochemistry in 72-hpf embryos are shown; dorsal views, anterior to the left (A–D). The mlct (arrows) axonal projections of wild-type embryos (A), wild-type embryos injected with tfap2α Mo (B), otpam866 mutant embryos injected with otpb Mo (C), and otpam866 mutant embryos coinjected with otpb and tfap2α Mo (D) were analyzed in the trunk part of the spinal cord. There are no obvious changes of the mlct in embryos injected with tfap2α Mo (arrow in B) compared with wild type (arrow in A). The injection of otpb Mo in otpam866 mutant embryos reduces the axons to one or two visible axonal fibers (arrow in C′; C′ is a ×2.5 magnification of C). No THir axons are detectable in embryos devoid of Otp and Tfap2α activity (asterisk in D′; D′ is a ×2.5 magnification of D). As a control, axons labeled by zn-5 antibody are not affected (A′,B′,C′′,D′′). A magenta green copy of this figure is available as Supporting Information Figure 4. Scale bars = 50 μm in A (applies to A–D); 50 μm in A′ (applies to A′,B′,C′′,D′′); 10 μm in C′,D′.
Figure 9
Figure 9
Schematic overview of DA and NA projections in 3-day-old zebrafish larvae. Schematic representation of major THir projection paths in correlation with anatomical location of DA (red) and NA (blue) somata summarized for the CNS of 3-dpf zebrafish larvae. Lateral (A) and dorsal (B) overviews. The relative dorsoventral position of the DA cells is indicated by different brightnesses, from dark red (dorsal) to light red (ventral). The numbering of ventral diencephalic DA groups is according to Rink and Wullimann (2002a): DC1, ventral thalamic DA neurons; DC2 and -4, rostral and caudal posterior tubercular DA neurons; DC3, medial hypothalamic DA neurons (liquor contacting); DC5 and -6, hypothalamic DA groups; DC7 is not listed here but correlates with the caudal hypothalamic groups shown here. The medial DA and NA projections in the hindbrain area represent individual axons observed at variable mediolateral positions (see Fig. 2H).

Similar articles

Cited by

References

    1. Björklund A, Dunnett SB. Dopamine neuron systems in the braan update. Trends Neurosci. 2007;30:194–202. - PubMed
    1. Björklund A, Skagerberg G. Evidence for a major spinal cord projection from the diencephalic A11 dopamine cell group in the rat using transmitter-specific fluorescent retrograde tracing. Brain Res. 1979;177:170–175. - PubMed
    1. Budick SA, O'Malley DM. Locomotor repertoire of the larval zebrafish: swimming, turning and prey capture. J Exp Biol. 2000;203:2565–2579. - PubMed
    1. Candy J, Collet C. Two tyrosine hydroxylase genes in teleosts. Biochim Biophys Acta. 2005;1727:35–44. - PubMed
    1. Chitnis AB, Kuwada JY. Axonogenesis in the brain of zebrafish embryos. J Neurosci. 1990;10:1892–1905. - PMC - PubMed

Publication types

MeSH terms

LinkOut - more resources