Review
. 2010 Jan;5(1):87-105.
doi: 10.2217/rme.09.69.

Characterizing functional stem cell-cardiomyocyte interactions

Affiliations
Review

Characterizing functional stem cell-cardiomyocyte interactions

Nenad Bursac et al. Regen Med. 2010 Jan.

Abstract

Despite the progress in traditional pharmacological and organ transplantation therapies, heart failure still afflicts 5.3 million Americans. Since June 2000, stem cell-based approaches for the prevention and treatment of heart failure have been pursued in clinics with great excitement; however, the exact mechanisms of how transplanted cells improve heart function remain elusive. One of the main difficulties in answering these questions is the limited ability to directly access and study interactions between implanted cells and host cardiomyocytes in situ. With the growing number of candidate cell types for potential clinical use, it is becoming increasingly more important to establish standardized, well-controlled in vitro and in situ assays to compare the efficacy and safety of different stem cells in cardiac repair. This article describes recent innovative methodologies to characterize direct functional interactions between stem cells and cardiomyocytes, aimed to facilitate the rational design of future cell-based therapies for heart disease.


Figures
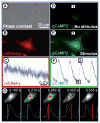
Figure 1
Figure 1. Optical recording of calcium transients in gCaMP2-expressing neonatal rat ventricular myocytes
(A) Cultured myocytes were transfected to express the mCherry fluorescent protein (B) as well as gCaMP2 (D & E). (C) During application of a 4-V/cm2 Hz field stimulus train, mCherry signal exhibited only bleaching and no fluctuations, while (F) gCaMP2 fluorescence levels significantly varied with changes in intracellular Ca2+ concentration. (G) Spatial distribution of color-coded gCaMP2 fluorescence intensity in a different cell at five time points during the Ca2+ transient. Fluorescent signals were recorded at 20× magnification using an Andor IxonEM+860 EMCCD camera and a Nikon TE2000U microscope.
Figure 2
Figure 2. In vitro settings for functional studies of stem cell–cardiomyocyte interactions
Co-culture settings in different rows increase in structural complexity from top to bottom. The number of + signs describes relative suitability of different settings for a specific type of functional study. (c) denotes control settings.
Figure 3
Figure 3. Heterocellular micropatterned cell pairs for studies of cell coupling
(A) Immunostaining examples for the expression of Cx43 gap junctions formed at short end-to-end contacts in homocellular neonatal rat ventricular myocytes (NRVMs) (1) and heterocellular NRVM– mesenchymal stem cell (MSC) (2) cell pairs, as well as at long side-to-side contacts of homocellular MSC–MSC pairs (3). No Cx43 junctions were formed in some homocellular MSC (4) and heterocellular (5) pairs despite the existing cell contact, while in other heterocellular pairs Cx43 expression was diffuse and intracellular (6). (B) Fluorescence recovery after photobleaching assay in micropatterned cell pairs. Left: calcein fluorescence (green) in a heterocelluar NRVM–MSC pair immediately before bleaching, immediately after bleaching (a), 1 min after bleaching (b) and 4 min after bleaching (c). Right: time course of fluorescence recovery with the points corresponding to the images shown left. (C) Dual whole cell patch clamp in micropatterned cell pairs. A cell pair made of two square-shaped cells was analyzed by clamping both cells to the same holding potential. A voltage stimulus was applied to one cell (V1 or V2) to elicit a current response from the other cell (I2 or I1) equal to the junctional current. These experiments enable the quantification of macroscopic gap junctional conductance (120 nS in this NRVM–NRVM pair). Dashed line denotes 0 mV or 0 nA. Cx43: Connexin-43; WGA: Wheat germ agglutinin.
Figure 4
Figure 4. Heterocellular micropatterned strands for studies of electrical conduction
(A & B) Examples of ‘mixed’ strands, where neonatal rat ventricular myocytes (red) are co-cultured with (A) genetically or (B) chemically labeled rMSCs (green). (C & D) Examples of cardiac strands with defined inserts made of different cell types. These strands were paced 5 mm left of the insert and intracellular Ca2+ transients were recorded with 37 μm resolution. Traces at recording sites 1–3 demonstrate that rat CFs, rMSCs or mCherry-labeled mESC-derived cardiomyocytes respectively caused conduction block, conducted passively without calcium transients or conducted actively with calcium transients. CF: Cardiac fibroblast; CM: Cardiac myocyte; cTnT: Cardiac troponin-T; GFP: Green fluorescent protein; mESC: Mouse embryonic stem cell; rMSC: Rat bone marrow-derived mesenchymal stem cell.
Figure 5
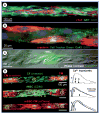
Figure 5. Heterocelluar monolayers for studies of cardiac arrhythmias
(A & B) Examples of ‘mixed’ aligned (anisotropic) monolayers where neonatal rat ventricular myocytes (NRVMs; F-actin or sarcomeric a-actinin) are interspersed with (A) cardiac fibroblasts (vimentin) or (B) mesenchymal stem cells (MSCs; unstained, shown by arrowheads). (C & D) Example of NRVM monolayers with central islands made of (C) pure GFP-labeled mouse embryonic stem cell-derived cardiomyocytes or (D) mixed NRVMs and fibroblasts (unstained, shown by arrowheads). Note well-defined and confluent contact between the cells in island and surrounding NRVMs. (E & F) Mapping of action potential propagation in the NRVM monolayer from (D) during (E) 3-Hz steady pacing and (F) a 6-Hz pacing burst. Successive isovoltage frames with corresponding times given at their top right corners are shown from left to right and top to bottom. Blue and red denote rest and peak of the action potential. Arrows show the direction of propagation. Pulse signs denote pacing sites. Small black circles are the 504 recording sites. Central circle is the border of the central island. Note slowing of impulse propagation through the island at 3-Hz pacing rate (E). During 6-Hz pacing burst (F), the propagating action potential wave breaks in the island area and a self-sustained reentrant wave forms in the cardiac-only area (shown at 195 ms). With time, the reentrant wave drifts, and after 1.5 s anchors at a location within the island (last three frames). Stars denote the tip of the reentrant wave. GFP: Green fluorescent protein.
Figure 6
Figure 6. Heterocellular bilayers for studies of electrical loading
(A) After 5 days of culture, confluent aligned NRVMs (green) are covered on top with loading cells (red) at a desired density. (B) Example of a 2 day co-culture with cardiac fibroblasts as the loading cells. (C) Action potential propagation is optically mapped during electrical stimulation from the center of the monolayer (pulse sign). Circles denote recording sites. Activation isochrones are elliptical as a consequence of the NRVM alignment. NRVM: Neonatal rat ventricular myocyte.
Figure 7
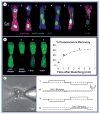
Figure 7. Heterocellular tissue bundles for studies of force generation
(A) Example of a cardiac bundle attached to Velcro® felts and mounted within the force measurement setup. (B) Pure (control) cardiac bundles after 2 weeks of culture contain aligned, cross-striated and coupled neonatal rat ventricular myocytes (NRVMs). (C) An example of a 2-week-old ‘mixed’ bundle containing co-aligned NRVMs (green) and mCherry-labeled mESC-CMs (red). (D) Example of a cardiac bundle with central bridge made of mESC-CMs, cultured inside a silicone ‘boat’. Live fluorescence overlaid with phase contrast demonstrates the location of the mESC-CM bridge. (E) Traces of isometric contractile force in cardiac bundles elicited at different frequencies by a field electrode. (F) Negative force-frequency relationship characteristic of mouse and rat hearts. (G) Force-length relationship exhibits physiological shape. CM: Cardiac myocyte; mESC: Mouse embryonic stem cell.

Similar articles

Cited by

References

    1. Rosamond W, Flegal K, Furie K, et al. Heart Disease and Stroke Statistics—2008 Update. A Report From the American Heart Association Statistics Committee and Stroke Statistics Subcommittee. Circulation. 2008;117:e25–e146. - PubMed
    1. Marelli D, Desrosiers C, El-Alfy M, Kao RL, Chiu RC. Cell transplantation for myocardial repair: an experimental approach. Cell Transplant. 1992;1(6):383–390. - PubMed
    1. Koh GY, Klug MG, Soonpaa MH, Field LJ. Differentiation and long-term survival of c2c12 myoblast grafts in heart. J Clin Invest. 1993;92(3):1548–1554. - PMC - PubMed
    1. Menasche P, Alfieri O, Janssens S, et al. The myoblast autologous grafting in ischemic cardiomyopathy (magic) trial. First randomized placebo-controlled study of myoblast transplantation. Circulation. 2008;117(9):1189–1200. - PubMed
    1. Haider H, Lei Y, Ashraf M. Myocell, a cell-based, autologous skeletal myoblast therapy for the treatment of cardiovascular diseases. Curr Opin Mol Ther. 2008;10(6):611–621. - PMC - PubMed

Publication types