. 2009 Dec 17:7:87.
doi: 10.1186/1741-7007-7-87.

The obesity and inflammatory marker haptoglobin attracts monocytes via interaction with chemokine (C-C motif) receptor 2 (CCR2)

Affiliations

The obesity and inflammatory marker haptoglobin attracts monocytes via interaction with chemokine (C-C motif) receptor 2 (CCR2)

Margherita Maffei et al. BMC Biol. .

Abstract

Background: Obesity is a chronic low inflammatory state. In the obesity condition the white adipose tissue (WAT) is massively infiltrated with monocytes/macrophages, and the nature of the signals recruiting these inflammatory cells has yet to be fully elucidated. Haptoglobin (Hp) is an inflammatory marker and its expression is induced in the WAT of obese subjects. In an effort to elucidate the biological significance of Hp presence in the WAT and of its upregulation in obesity we formulated the hypothesis that Hp may serve as a macrophage chemoattractant.

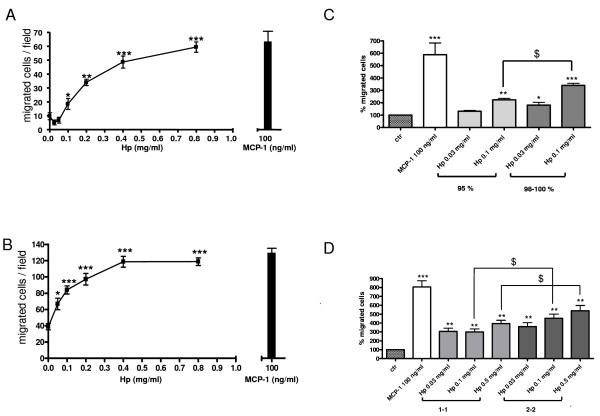
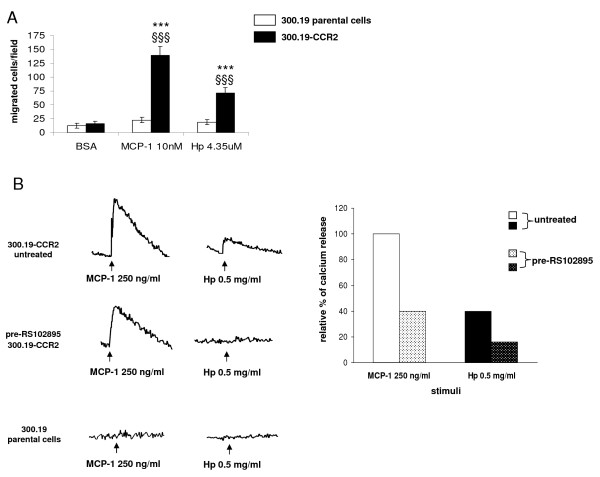
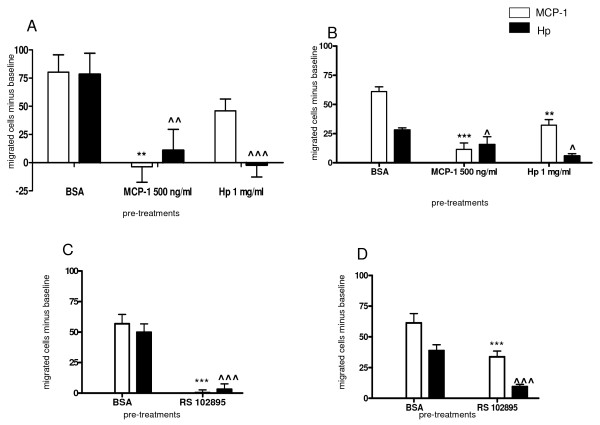
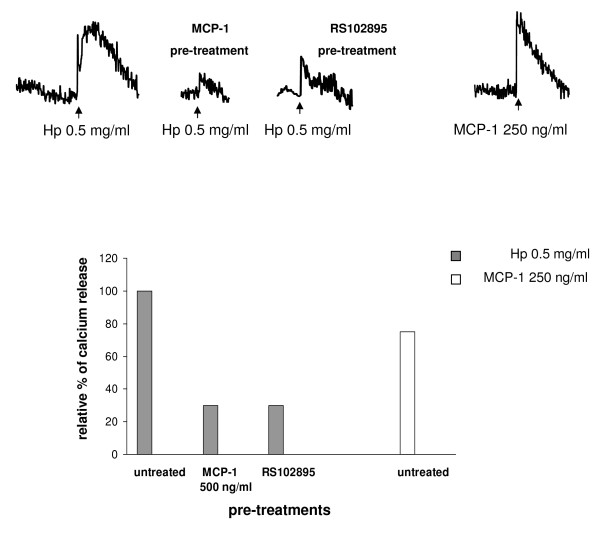
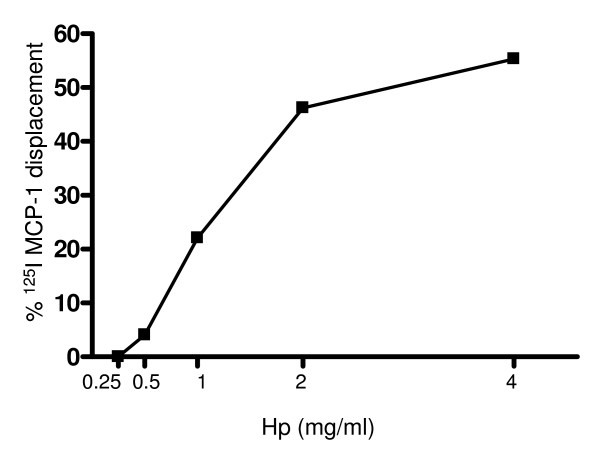
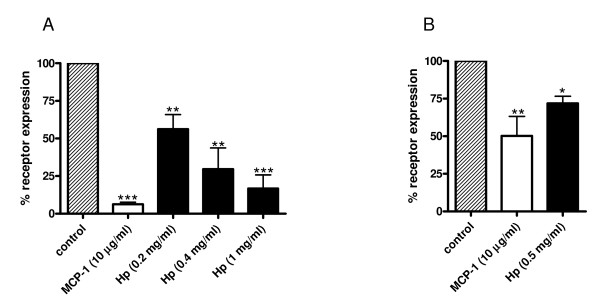
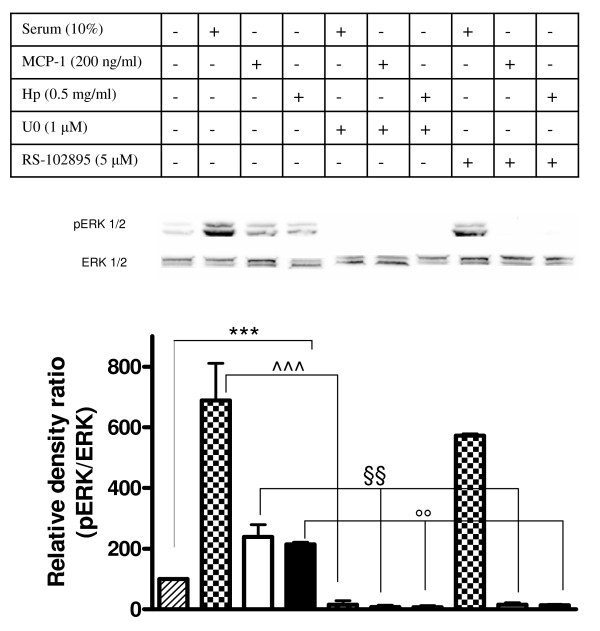
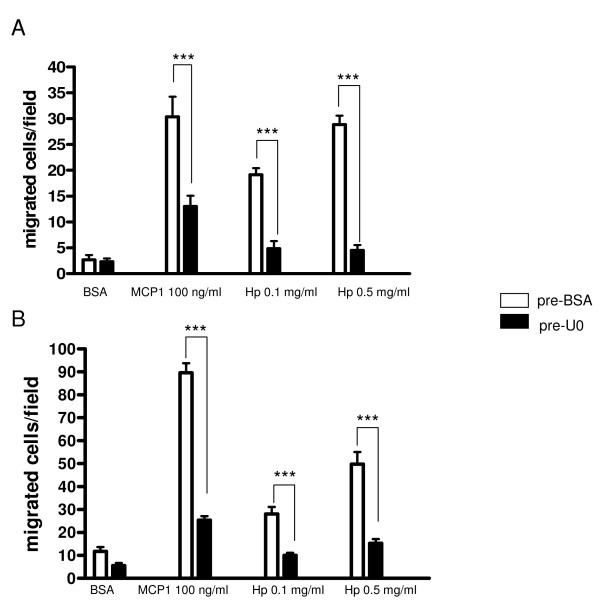
Results: We demonstrated by chemotaxis assay that Hp is able to attract chemokine (C-C motif) receptor 2 (CCR2)-transfected pre-B lymphocytes and monocytes in a dose-dependent manner. Moreover, Hp-mediated migration of monocytes is impaired by CCR2-specific inhibition or previous cell exposure to monocyte chemoattractant protein 1 (MCP1) (also known as CCR2 ligand or chemokine (C-C motif) ligand 2 (CCL2)). Downstream effects of Hp/CCR2 interaction were also investigated: flow cytometry proved that monocytes treated with Hp show reduced CCR2 expression on their surface; Hp interaction induces calcium release that is reduced upon pretreatment with CCR2 antagonist; extracellular signal-regulated kinase (ERK)1/2, a signal transducer activated by CCR2, is phosphorylated following Hp treatment and this phosphorylation is reduced when cells are pretreated with a specific CCR2 inhibitor. Consistently, blocking the ERK1/2 pathway with U0126, the selective inhibitor of the ERK upstream mitogen-activated protein (MAP)-ERK kinase (MEK), results in a dramatic reduction (by almost 100%) of the capability of Hp to induce monocyte migration.

Conclusions: Our data show that Hp is a novel monocyte chemoattractant and that its chemotactic potential is mediated, at least in part. by its interaction with CCR2.


Figures

Figure 1
Figure 1
Effect of haptoglobin (Hp) on U937 monocytes (a, c and d) and human primary monocytes migration (b). (a) Chemotaxis was performed on U937 cells for 3 h at the indicated doses of Hp and monocyte chemoattractant protein 1 (MCP1). In the case of the negative control bovine serum albumin (BSA) (1 mg/ml) was used. (b) Chemotaxis was performed on primary monocytes for 90 min. One-way analysis of variance (ANOVA), P < 0.0001. Bonferroni post-test versus BSA *P < 0.05, ***P < 0.001. (c, d) Chemotaxis was performed on U937 cells for 3 h at the indicated doses. Migrated cells are expressed as percentage of the average number of migrated cells in the negative control wells (BSA, 1 mg/ml). (c) Bar graph showing the comparison between the chemotactic potential of Hp 95% pure (premade mixture of phenotypes 1-1, 2-1 and 2-2, light gray bars) and that of Hp 98% to 100% pure (homemade mixtures of phenotypes 1-1 and 2-2, dark gray bars). One-way ANOVA, P < 0.0001. Bonferroni post-test versus BSA *P < 0.05, **P < 0.01, ***P < 0.001. Bonferroni post-test Hp 95% versus Hp 98% to 100% $P < 0.05. (d) Bar graph showing the comparison between chemotactic potential of Hp 1-1 (light gray bars) versus Hp 2-2 (dark gray bars). One-way ANOVA, P < 0.0001. Bonferroni post-test versus BSA **P < 0.01, ***P < 0.001. Bonferroni post-test Hp 1-1 versus Hp 2-2 $P < 0.05. Data are expressed as means ± standard error of the mean (SEM) of migrated cells for at least three independent experiments.
Figure 2
Figure 2
Effect of haptoglobin (Hp) on cell migration and calcium release in pre-B lymphocytes 300.19 stably expressing chemokine (C-C motif) receptor 2 (CCR2) (300.19-CCR2). (a) Chemotaxis was performed on 300.19 and 300.19-CCR2 cells for 3 h at the indicated doses of Hp and monocyte chemoattractant protein 1 (MCP1). Bovine serum albumin (BSA) (1 mg/ml) was used as negative control. Two-way analysis of variance (ANOVA), P < 0.0001. Bonferroni post-test versus BSA ***P < 0.001, versus 300.19 parental cells §§§P < 0.001. (b) Left panel, fura-2 acetoxymethyl ester (fura-2 AM) preloaded 300.12-CCR2 cells untreated or pretreated with 5 μM RS102895 were stimulated with 250 ng/ml MCP1 or 0.5 mg/ml Hp, right panel quantification of [Ca2+]i rise in 300.19-CCR2 cells. The rate of [Ca2+]i rise (percentage fura-2 saturation/s) induced by MCP1 was set to 100% and the rate after pretreatment was calculated. At the bottom on the left, stimulation of 300.19 parental cells did not result in any appreciable calcium flux. The results are representative of three independent experiments.
Figure 3
Figure 3
Monocyte chemoattractant protein 1 (MCP1) and haptoglobin (Hp) show reciprocal interference on the capacity of cells to migrate. (a) Bar graph showing the effect of pretreatment (45 min at 37°C) with MCP1 (500 ng/ml), Hp (1 mg/ml) or bovine serum albumin (BSA) (1 mg/ml) on the capacity of U937 cells to migrate towards MCP1 (100 ng/ml white bars) and Hp (0.5 mg/ml, black bars). For each treatment the number of cells that migrated towards a chemotactically neutral agent (BSA 1 mg/ml) was considered as a baseline and subtracted from the numbers obtained for migration against MCP1 and Hp. Data are expressed as means ± standard error of the mean (SEM) of migrated cells for at least four experiments. Two-way analysis of variance (ANOVA) on the effect of pretreatment, P < 0.001. Bonferroni post-test versus pretreatment with BSA **P < 0.01 for migration towards MCP1, ^P < 0.01 for migration towards Hp. (b) As (a), using human primary monocytes. Two-way ANOVA on the effect of pretreatment, P < 0.001. Bonferroni post-test versus pretreatment with BSA ***P 0.001 **P < 0.01 for migration towards MCP1, ^P < 0.05 for migration towards Hp. (c) Bar graph showing the effect of pretreatment with the chemokine (C-C motif) receptor 2 (CCR2) synthetic antagonist RS102895 (5 μM) or BSA (1 mg/ml) on the capacity of U937 cells to migrate towards MCP1 (100 ng/ml white bars) and Hp (0.5 mg/ml, black bars). For each treatment the number of cells migrated towards a chemotactically neutral agent (BSA 1 mg/ml) was considered as a baseline and subtracted from the numbers obtained for migration against MCP1 and Hp. Data are expressed as means ± SEM of migrated cells for at least four experiments. Two-way ANOVA on the effect of pretreatment, P < 0.001. Bonferroni post-test versus pretreatment with BSA ***P < 0.001 for migration towards MCP1, ^^^P < 0.001 for migration towards Hp. (d) Same as (c) performed with primary monocytes. Data are expressed as means ± SEM of migrated cells for at least four experiments. Two-way ANOVA on the effect of pretreatment, P < 0.0001. Bonferroni post-test versus pretreatment with BSA ***P < 0.001 for migration towards MCP1, ^^^P < 0.001 for migration towards Hp.
Figure 4
Figure 4
Effect of haptoglobin (Hp) on calcium release in U937 cells. Upper panel: fura-2 acetoxymethyl ester (fura-2 AM) preloaded U937 cells untreated or pretreated with 500 ng/ml monocyte chemoattractant protein 1 (MCP1) or 5 μM RS102895 were stimulated with 0.5 mg/ml Hp. Untreated cells were stimulated with 250 ng/ml MCP1 as a positive control. Bottom panel: quantification of [Ca2+]i rise in U937 cells. The rate of [Ca2+]i rise (percentage fura-2 AM saturation/s) induced by Hp was set to 100% and the rate after pretreatments was calculated. The result is representative of three independent experiments.
Figure 5
Figure 5
[125I]Monocyte chemoattractant protein 1 (MCP1) displacement from chemokine (C-C motif) receptor 2 (CCR2) by haptoglobin (Hp). U937 cells were incubated with the indicated Hp concentrations for 1 h at room temperature and the specific radioactivity was measured by γ counter after free from bound separation. The graph shows one experiment representative of three.
Figure 6
Figure 6
Haptoglobin (Hp) induces chemokine (C-C motif) receptor 2 (CCR2) internalization. U937 cells and primary monocytes were incubated for 60 min at 37°C, 5% CO2 with increasing concentrations of Hp or monocyte chemoattractant protein 1 (MCP1) as positive control. The relative surface expression of CCR2 was determined by flow cytometry after staining with monoclonal antibodies to the chemokine receptor. (a) Bar graph showing the relative mean fluorescence on U937 cells. The dark-striped white bar shows CCR2 expression on U937 cells without treatment. The white bar indicates the percentage of receptor present on the surface after incubation with MCP1 (10 μg/ml) and the black bars indicate the percentage of receptor present on the surface after incubation with Hp at the indicated concentrations. (b) Bar graph showing the relative mean fluorescence on primary monocytes. The dark-striped white bar shows CCR2 expression on U937 cells without treatment. The white bar indicates the percentage of receptor present on the surface after incubation with MCP1 (10 μg/ml) and the black bars indicate the percentage of receptor present on the surface after incubation with Hp at 8.7 μM. Data are expressed as means ± standard error of the mean (SEM) of three independent experiments. Student t test on the effect of treatment versus control: *P < 0.05; **P < 0.01; ***P < 0.001.
Figure 7
Figure 7
Haptoglobin (Hp) induces extracellular signal-regulated kinase (ERK) activation in monocytes. U937 cells were serum starved with 1% serum overnight. Cells were then pretreated or not treated with U0126 (10 min, 1 μM) or RS102895 (30 min, 5 μM) prior to incubation with 10% serum, monocyte chemoattractant protein 1 (MCP1) (200 ng/ml) or Hp (0.5 mg/ml) for 2 min. Harvested cells were lysed and extracted proteins were separated on 12% SDS polyacrylamide gel (50 μg per lane). Activation of ERK1/2 was detected with anti-phospho-ERK antibody. The membrane was stripped and reprobed with anti-ERK1/2 antibody for internal control. In the bottom panel, the bar graph shows the quantification of pERK1/2. Data are expressed as means ± standard error of the mean (SEM) for three experiments. Student t test on the effect of serum, MCP1 and Hp versus serum starved cells on ERK1/2 activation. ***P < 0.001. Two-way analysis of variance (ANOVA) on the effect of pretreatment with U0126 or RS102895 on ERK1/2 activation induced by serum, MCP1 and Hp, P < 0.0001. Bonferroni post-test. ^^^P < 0.001 versus serum stimulated cells, §§P < 0.01 versus MCP1 stimulated cells, °°P < 0.01 versus Hp stimulated cells.
Figure 8
Figure 8
Haptoglobin (Hp)-mediated chemotaxis is inhibited by blocking extracellular signal-regulated kinase (ERK)1/2 intracellular pathway. (a) Bar graph showing the effect of pretreatment with U0126 (10 min, 1 μM at 37°C, black bars), or bovine serum albumin (BSA) (1 mg/ml, white bars) on the capacity of U937 cells to migrate towards monocyte chemoattractant protein 1 (MCP1) (100 ng/ml) and Hp (0.1 and 0.5 mg/ml). Data are expressed as means ± standard error of the mean (SEM) of migrated cells for at least three experiments. Two-way analysis of variance (ANOVA) P < 0.001. Bonferroni post-test versus pretreatment with BSA ***P < 0.001. (b) As (a) using human primary monocytes. Two-way ANOVA P < 0.001. Bonferroni post-test versus pretreatment with BSA ***P < 0.001.

References

    1. de Kleijn DP, Smeets MB, Kemmeren PP, Lim SK, Van Middelaar BJ, Velema E, Schoneveld A, Pasterkamp G, Borst C. Acute-phase protein haptoglobin is a cell migration factor involved in arterial restructuring. FASEB J. 2002;16:1123–1125. - PubMed
    1. Chiellini C, Bertacca A, Novelli SE, Görgün CZ, Ciccarone A, Giordano A, Xu H, Soukas A, Costa M, Gandini D, Dimitri R, Bottone P, Cecchetti P, Pardini E, Perego L, Navalesi R, Folli F, Benzi L, Cinti S, Friedman JM, Hotamisligil GS, Maffei M. Obesity modulates the expression of haptoglobin in the white adipose tissue via TNFalpha. J Cell Physiol. 2002;190:251–258. doi: 10.1002/jcp.10061. - DOI - PubMed
    1. Chiellini C, Santini F, Marsili A, Berti P, Bertacca A, Pelosini C, Scartabelli G, Pardini E, López-Soriano J, Centoni R, Ciccarone AM, Benzi L, Vitti P, Del Prato S, Pinchera A, Maffei M. Serum haptoglobin: a novel marker of adiposity in humans. J Clin Endocrinol Metab. 2004;89:2678–2683. doi: 10.1210/jc.2003-031965. - DOI - PubMed
    1. Fain JN, Madan AK, Hiler ML, Cheema P, Bahouth SW. Comparison of the release of adipokines by adipose tissue, adipose tissue matrix, and adipocytes from visceral and subcutaneous abdominal adipose tissues of obese humans. Endocrinology. 2004;145:2273–2282. doi: 10.1210/en.2003-1336. - DOI - PubMed
    1. do Nascimento CO, Hunter L, Trayhurn P. Regulation of haptoglobin gene expression in 3T3-L1 adipocytes by cytokines, catecholamines, and PPARgamma. Biochem Biophys Res Commun. 2004;313:702–708. doi: 10.1016/j.bbrc.2003.12.008. - DOI - PubMed

Publication types

MeSH terms