. 2009 Dec 18:10:91.
doi: 10.1186/1471-2121-10-91.

Oxidative stress promotes autophagic cell death in human neuroblastoma cells with ectopic transfer of mitochondrial PPP2R2B (Bbeta2)

Affiliations

Oxidative stress promotes autophagic cell death in human neuroblastoma cells with ectopic transfer of mitochondrial PPP2R2B (Bbeta2)

Wan-Ting Cheng et al. BMC Cell Biol. .

Abstract

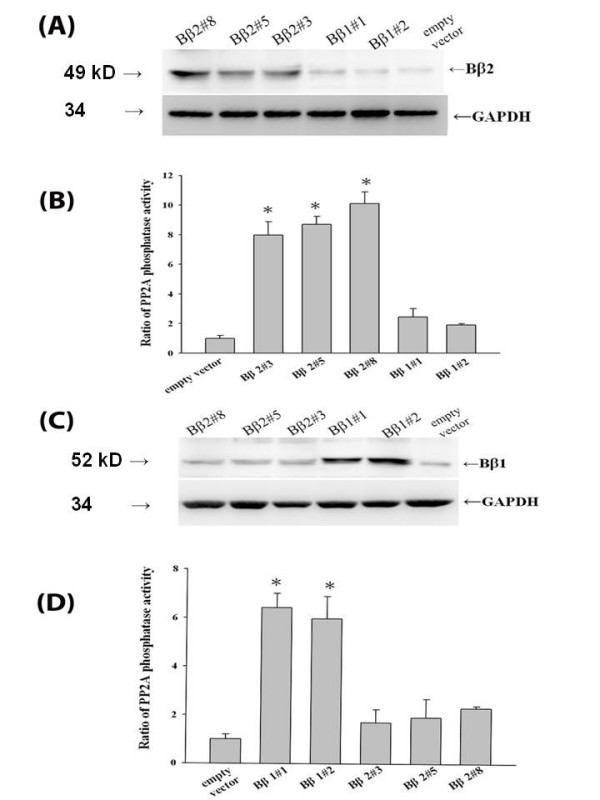
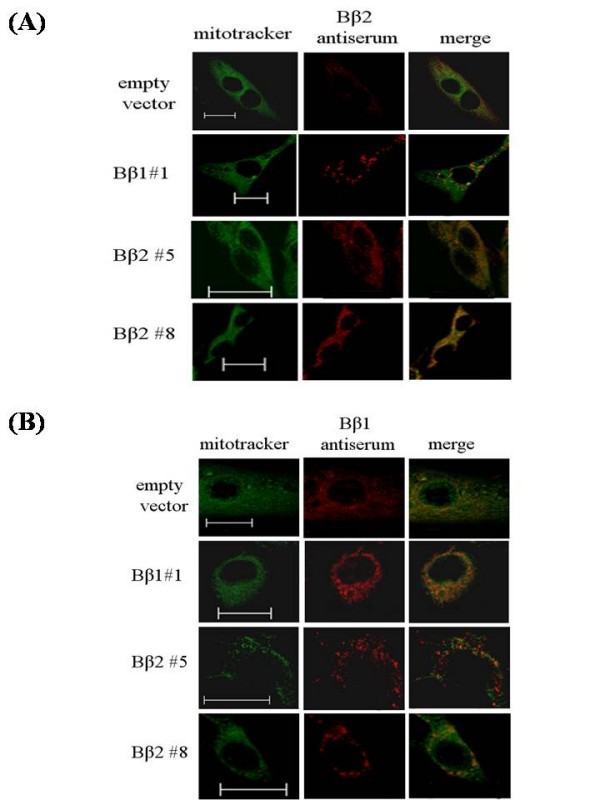
Background: The multifunctional protein phosphatase 2A (PP2A) is a heterotrimeric serine/threonine protein phosphatase composed of a scaffolding, catalytic and regulatory subunits. By modifying various downstream signal transducers, the aberrant expression of the brain-targeted regulatory subunit PPP2R2B is associated with the onset of a panel of neuronal disorders. The alternatively splicing of PPP2R2B encodes two regulatory subunit isoforms that determine cellular distribution of the neuron-specific holoenzyme to mitochondria (Bbeta2) and cytoplasm (Bbeta1), respectively.

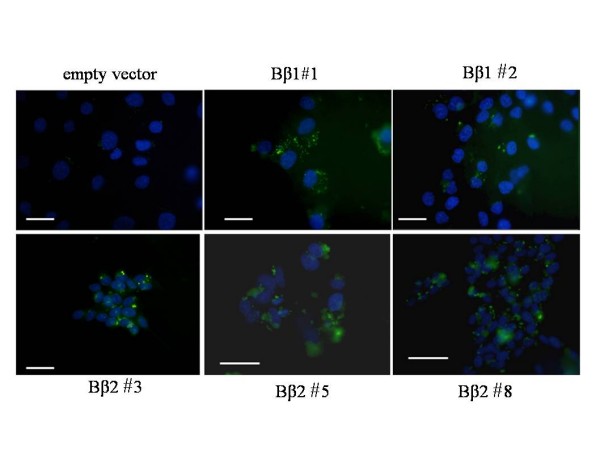
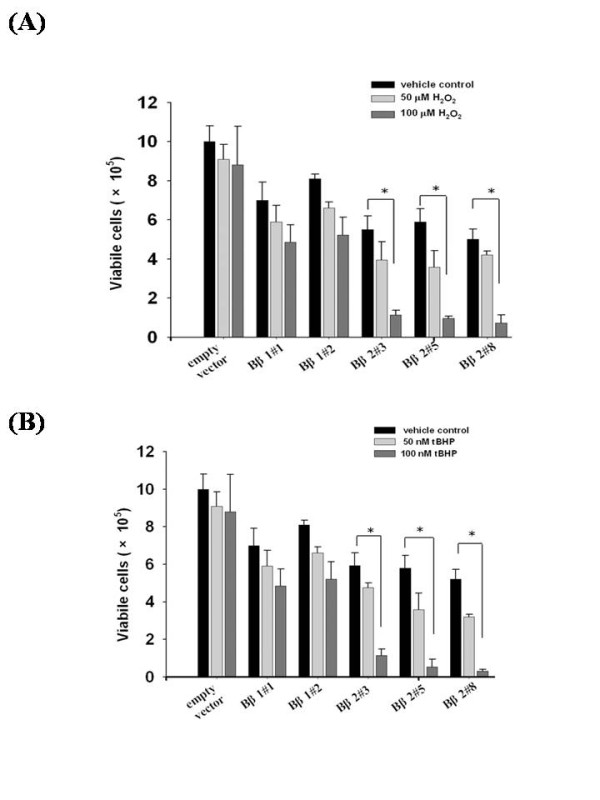
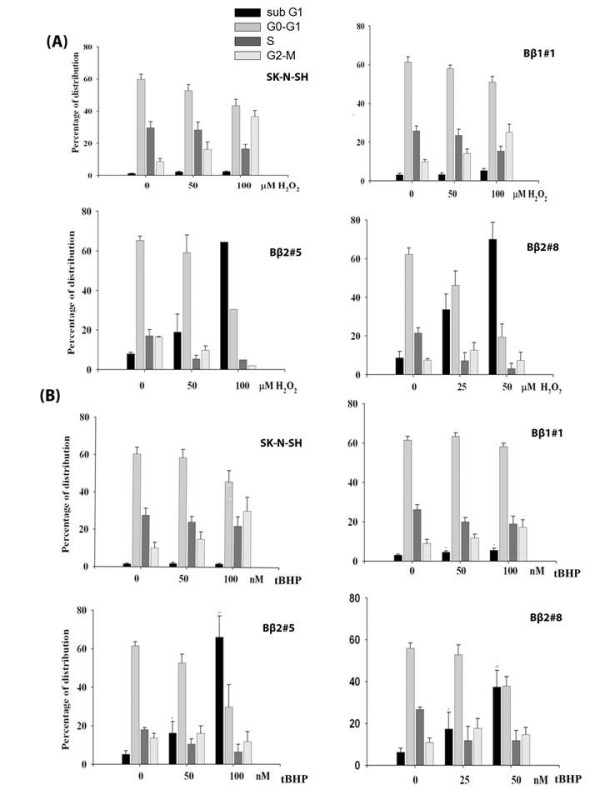
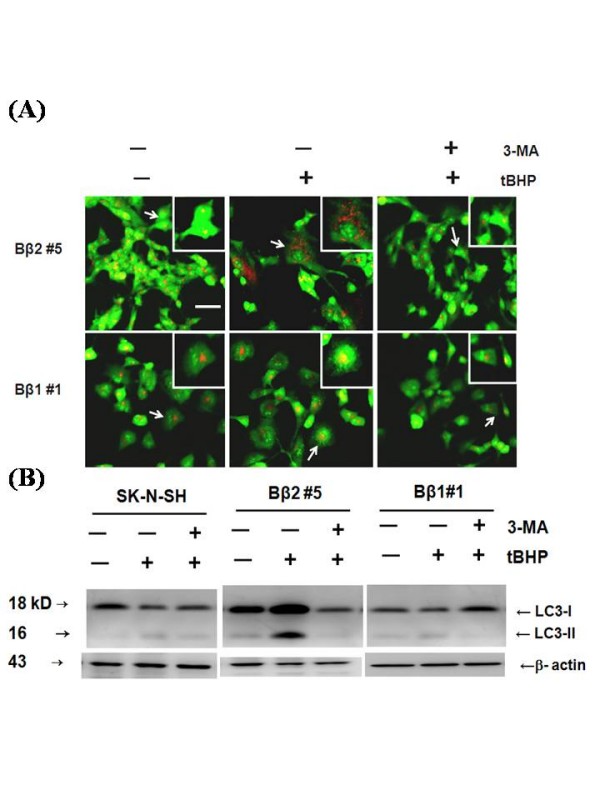
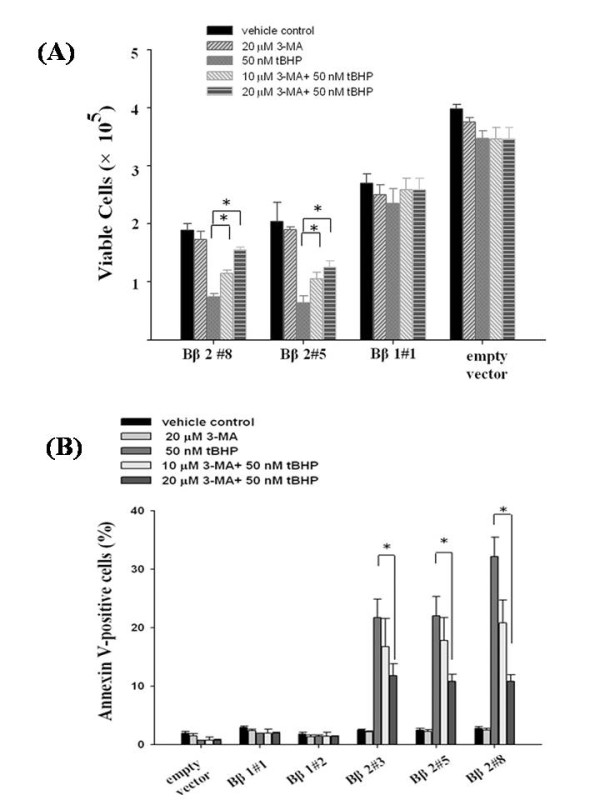
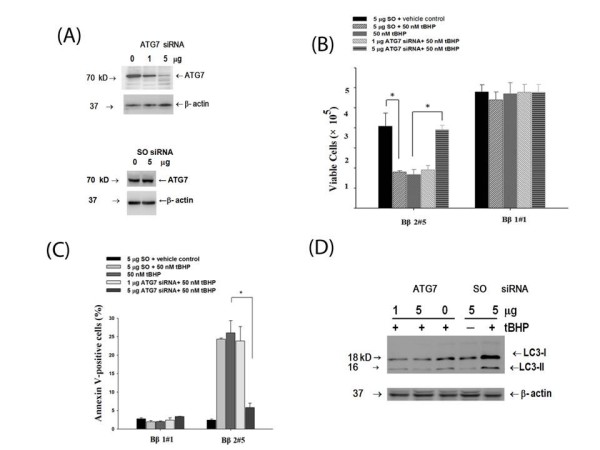
Results: Human neuroblastoma cells were transfected with PPP2R2B constructs encoding the complete sequences of Bbeta2 and Bbeta1, respectively. The colonies with antibiotic resistance were selected as stable cell lines. Both ectopic Bbeta1 and Bbeta2 clones exhibited characteristics of autophagy. To test how cells respond to reactive oxygen species generators, the cells were treated with either hydrogen peroxide or t-butyl hydroperoxide and Bbeta2 clones induced cell death. Suppression of autophagy using either RNA interference of the essential autophagy gene or pharmacological inhibitor rescued cell death caused by oxidative stress.

Conclusions: Cells with ectopically expressed mitochondria-targeted regulatory subunit PPP2R2B of the holoenzyme PP2A were shown predisposed to autophagy and oxidative stress induced cell death that is related to apoptosis. The results promised a model for studying the mechanism and function of aberrant PPP2R2B expression in neuronal cells. The work provided a new target for understanding and prevention of neuropathogenesis.


Figures

Figure 1
Figure 1
Both immunoactive Bβ1 and Bβ2 clones acquired enhanced PP2A activity (A). Cell lysates of SK-N-SH cells, Bβ1 and Bβ2 clones were probed with signal sequence-specific Bβ2 antiserum. The blots were detected with ECL system following incubation with secondary HRP-conjugated goat against rabbit antibody. The ectopic expressions of Bβ2 were detected Bβ2 (A) clones. Each blot was reprobed with glucose-6-phosphate dehydrogenase (GAPDH) antibody to confirm equal loading of the proteins. (B) The PP2A phosphatase activities of Bβ2 clones were determined by immunoprecipitating cell lysates with Bβ2 antisera as described in Materials and Methods. Characterizations of clones Bβ1#1 and Bβ1#2 (C) Cell lysates of SK-N-SH cells, Bβ1 and Bβ2 clones were probed with Bβ1 antiserum and reprobed with GAPDH antibody to confirm equal loading of the proteins. The blots were detected with ECL system. (D) The PP2A phosphatase activities of Bβ1 clones were determined by immunoprecipitating cell lysates with Bβ1 antisera as described before. The results represented fold of increase of activity relative to control of SK-N-SH with empty vector shown as average values in three individual experiments. The result represented mean values of three individual determinations; the bars standard errors in three independent experiments as conducted. *P < 0.05, significance of difference as compared with the control group.
Figure 2
Figure 2
Differential subcellular localization of ectopic Bβ2 and Bβ1 by confocal image analysis. (A) Cells were immunostained with antiserum against β2 (red) and counter-stained with mitotracker (green) and visualized by confocal microscopy. The merged graph showed that β2 was colocalized as yellow colors at mitochondria in clone Bβ2 #5 and #8. (B) Cells were immunostained with antiserum against β1 (red) and mitotracker as before. The merged graph showed that ectopic β1 can be distributed in cytoplasm in clone Bβ1#1 as compared with SK-N-SH cells. Bar, 20 μm.
Figure 3
Figure 3
Autophagosome formation expressing GFP-LC3 puncta in Bβ2 and Bβ1 clones. The parental SK-N-SH cells and Bβ1 and Bβ2 clones were transfected with GFP-LC3 plasmid for 48 h and observed under the fluorescence microscope for GFP (green) followed by counter-staining with DAPI(blue). Puncta fluorescence in GFP-LC3 transfected cells can be detected in cells of both Bβ1 and Bβ2 clones. Bars, 20 μm.
Figure 4
Figure 4
Cells growth curves as affected by various concentrations of H2O2 and tBHP. The exponentially growing SK-N-SH cells or Bβ1 and Bβ2 clones were seeded at a total of 2 × 10⁵ cells per 6-cm plate and treated with different concentrations of H2O2 (0, 50 and 100 μM, respectively) (A) or tBHP (0, 50 and 100 nM, respectively) (B). After 48 h of treatment, the cells were trypsinized and counted by trypan blue exclusion assay. The result represented mean values of three individual determinations; the bars standard errors in three independent experiments as conducted. *P < 0.05, significance of difference as compared with the control group.
Figure 5
Figure 5
Both H2O2 and tBHP increased sub-G1 cell populations in different Bβ2 clones as indicated by cell cycle histograms. Exponential growing cells were cultured with different concentrations of H2O2 or tBHP for 48 h. The trypsinized cells were analyzed by flow cytometry following staining with propidium iodide. The percentage distribution of cell cycle phases for H2O2 (A, top) or tBHP (B, bottom) was determined by Cell Quest software. The results represented averages of three independent experiments and the results were average values in three individual experiments as mean ± standard errors of three independent experiments.
Figure 6
Figure 6
The inhibitor 3-MA suppressed autophagy development in cells with ectopic Bβ2. (A) Autophagosome formation by acridine orange staining. Cells plated on coverslips in 6-well plates were either pretreated with (+) or without (-) autophagy inhibitor 3-MA before being given 50 nM tBHP for 48 h. The cells were then fixed and stained with acridine orange (green) and analyzed by fluorescence microscopy. The formation of autophagosome as shown in puncta fluorescence (red) can be suppressed by 3-MA. The presence of autophagy was found mainly in 100% of the cells after treatment, in which more than 100 cells were observed under each condition. Scales, 50 μm. Cells as pointed out by arrows were amplified as shown in the inset (2×). (B) Western blot probed with LC3 antibody The development of autophagy by tBHP in the presence (+) or absence (-) of 3-MA was analyzed by western blot analysis by incubating the blot with LC3 antibody. Levels of the 18-kDa LC3-I is visualized in both Bβ2 and Bβ1 clones. Elevated LC3-II, the 16-kDa form of LC3 specific for membranes of autophagosomes by tBHP in Bβ2 clones was suppressed by 3-MA.
Figure 7
Figure 7
The autophagy inhibitor rescued tBHP-induced cell death in Bβ2 clones. (A) Cell growth determination A total of 1 × 10⁵ exponentially growing cells were cultured with either 10 or 20 μM of 3-MA before being treated with 50 nM of tBHP for 48 h. The cells were then trypsinized and counted for viable cells by trypan-blue staining. The results represented averages of three independent experiments and error bars standard errors. (B) tBHP-induced apoptotic cell death can be blocked by 3-MA Annexin V binding in Bβ2 clones was determined by flow cytometry 48 h after treatment with 50 nM of tBHP in the presence and absence of 10 or 20 μM of 3-MA, respectively, using SK-N-SH cells as control. The results represented averages of three independent experiments and error bars standard errors. Data are represented as the mean ± standard errors of three independent experiments, each performed in duplicate. *P < 0.05, significance of difference as compared with the control group.
Figure 8
Figure 8
Transfer of ATG7 siRNA blocked tBHP-induced cell death in Bβ2#5 clone. A total of 1 × 10⁶ exponentially growing cells of both Bβ2#5 and Bβ1#1 clones were transfected with either scrambled siRNA (SO) control or ATG7 siRNA, treated with tBHP and analyzed. (A) Knocked-down ATG5 expression by the increased ATG7 siRNA Cell lysates of Bβ2#5 clones were probed with ATG7 antibody and reprobed with β-actin antibody to confirm equal loading of the proteins. The blots were then detected with ECL system. (B) Cell growth Both Bβ2#5 and Bβ1#1 clones were treated with tBHP for 48 h following transfection with either SO control or ATG7 siRNA. The viable cells were determined by trypan-blue staining. (C) Determination of apoptotic cells Distribution of annexin V binding in both clones was determined by flow cytometry after 48 h treatment with 50 nM of tBHP. The results represented averages of three independent experiments and error bars standard errors. Data are represented as the mean ± standard errors of three independent experiments, each performed in duplicate. *P < 0.05, significance of difference as compared with the control group. (D) Western blot analysis with LC3 antibody Development of autophagy by tBHP was analyzed by western blot analysis by incubating the blot with LC3 antibody with β-actin antibody as loading control. The elevated LC3-II as visualized the 16-kDa form of LC3 specific for membranes of the formed autophagosomes by tBHP in Bβ2 #5 clones was suppressed by the increased concentrations of ATG7 siRNA.

Similar articles

Cited by

References

    1. Mayer RE, Hendrix P, Cron P, Matthies R, Stone SR, Goris J, Merlevede W, Hofsteenge J, Hemmings BA. Structure of the 55-kDa regulatory subunit of protein phosphatase 2A: evidence for a neuronal-specific isoform. Biochemistry. 1991;30(15):3589–3597. doi: 10.1021/bi00229a001. - DOI - PubMed
    1. Price NE, Mumby MC. Brain protein serine/threonine phosphatases. Curr Opin Neurobiol. 1999;9(3):336–342. doi: 10.1016/S0959-4388(99)80049-X. - DOI - PubMed
    1. Strack S. Overexpression of the protein phosphatase 2A regulatory subunit Bgamma promotes neuronal differentiation by activating the MAP kinase (MAPK) cascade. J Biol Chem. 2002;277(44):41525–41532. doi: 10.1074/jbc.M203767200. - DOI - PubMed
    1. Strack S, Westphal RS, Colbran RJ, Ebner FF, Wadzinski BE. Protein serine/threonine phosphatase 1 and 2A associate with and dephosphorylate neurofilaments. Brain Res Mol Brain Res. 1997;49(1-2):15–28. doi: 10.1016/S0169-328X(97)00117-4. - DOI - PubMed
    1. Strack S, Zaucha JA, Ebner FF, Colbran RJ, Wadzinski BE. Brain protein phosphatase 2A: developmental regulation and distinct cellular and subcellular localization by B subunits. J Comp Neurol. 1998;392(4):515–527. doi: 10.1002/(SICI)1096-9861(19980323)392:4<515::AID-CNE8>3.0.CO;2-3. - DOI - PubMed

Publication types