. 2011 Nov;32(11):2030-44.
doi: 10.1016/j.neurobiolaging.2009.11.022. Epub 2009 Dec 16.

Fractalkine and CX 3 CR1 regulate hippocampal neurogenesis in adult and aged rats

Affiliations

Fractalkine and CX 3 CR1 regulate hippocampal neurogenesis in adult and aged rats

Adam D Bachstetter et al. Neurobiol Aging. 2011 Nov.

Abstract

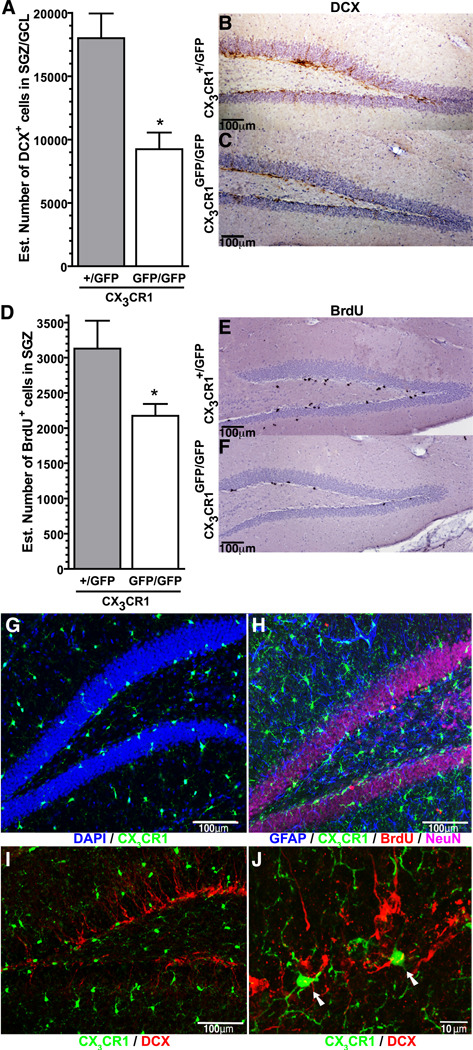
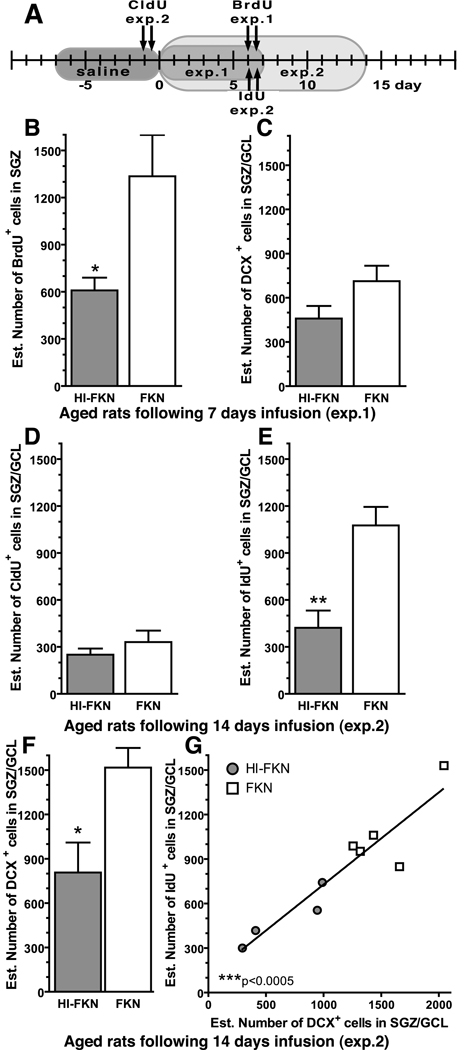
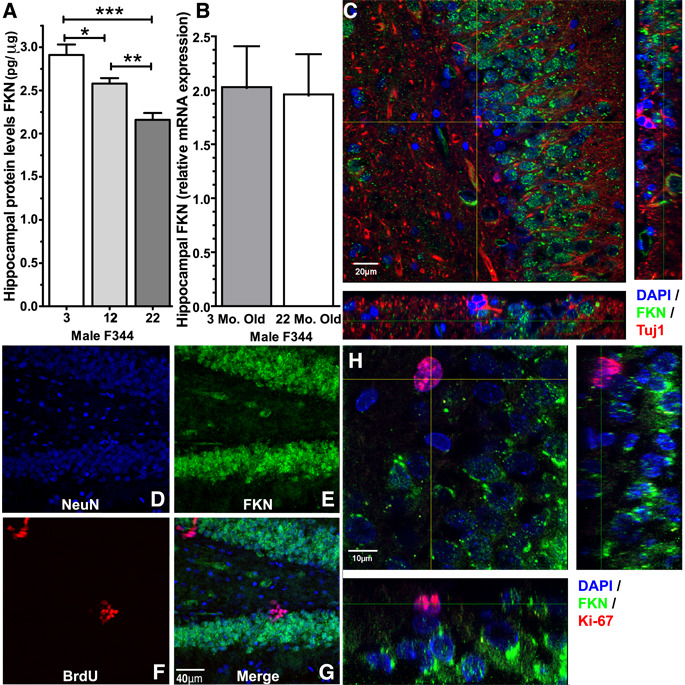
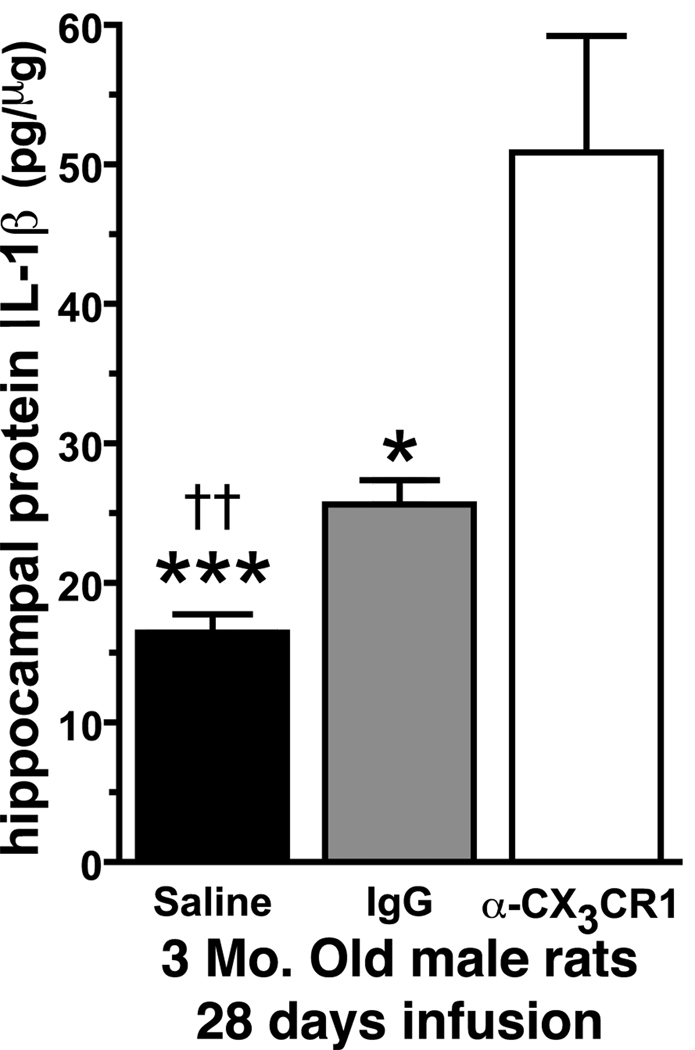
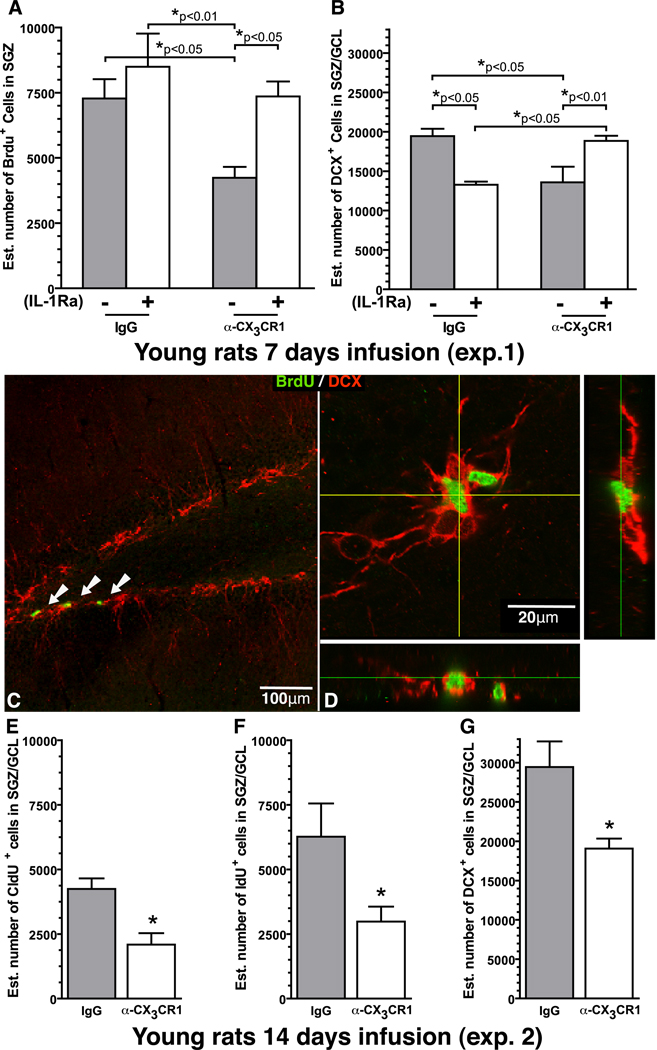
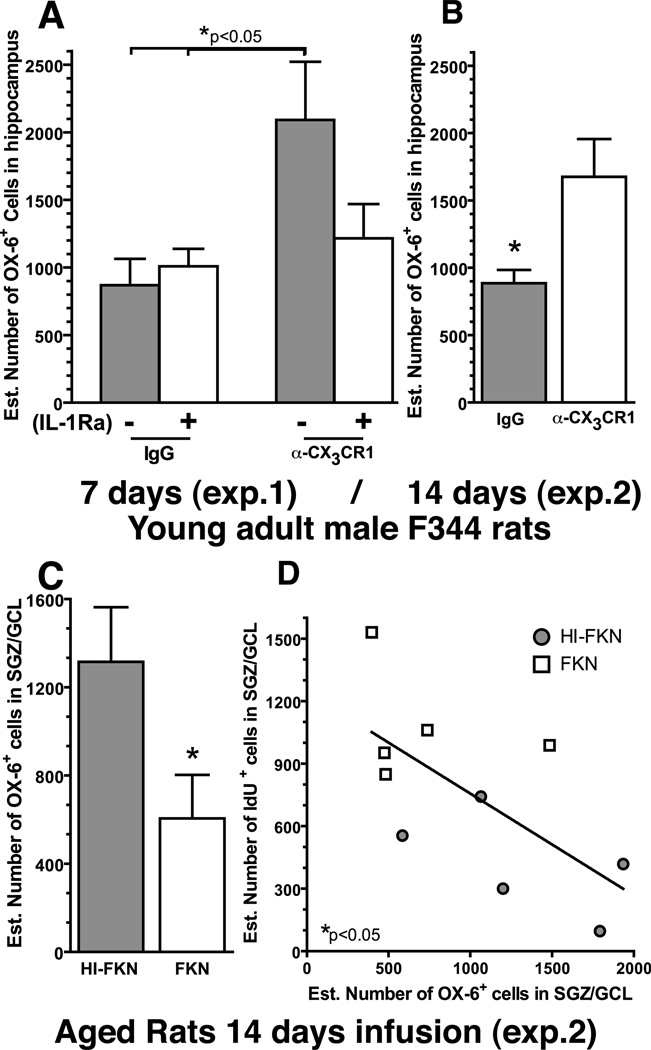
Microglia have neuroprotective capacities, yet chronic activation can promote neurotoxic inflammation. Neuronal fractalkine (FKN), acting on CX(3)CR1, has been shown to suppress excessive microglia activation. We found that disruption in FKN/CX(3)CR1 signaling in young adult rodents decreased survival and proliferation of neural progenitor cells through IL-1β. Aged rats were found to have decreased levels of hippocampal FKN protein; moreover, interruption of CX(3)CR1 function in these animals did not affect neurogenesis. The age-related loss of FKN could be restored by exogenous FKN reversing the age-related decrease in hippocampal neurogenesis. There were no measureable changes in young animals by the addition of exogenous FKN. The results suggest that FKN/CX(3)CR1 signaling has a regulatory role in modulating hippocampal neurogenesis via mechanisms that involve indirect modification of the niche environment. As elevated neuroinflammation is associated with many age-related neurodegenerative diseases, enhancing FKN/CX(3)CR1 interactions could provide an alternative therapeutic approach to slow age-related neurodegeneration.


Conflict of interest statement

Author Conflict of Interest: none

Figures

Figure 1
Figure 1. CX3CR1GFP/GFP mice have diminished hippocampal neurogenesis
(A) Unbiased stereology revealed a significant decrease in the number of DCX+ cells in the hippocampus of adult male CX3CR1GFP/GFP mice compared to heterozygote control *(t(9)=3.857; p=0.0062; CX3CR1GFP/GFP(n=5) vs. CX3CR1+/GFP (n=4)). Representative photomicrographs of the DCX+ cells in the brown immunohistochemical staining can be seen in the CX3CR1+/GFP mice (B) with fewer DCX+ cells seen in the CX3CR1GFP/GFP mice (C). (D) Quantification of the number of cells that were proliferating during the proceeding 24 hours, as determined by the incorporation of BrdU, was significantly fewer in the CX3CR1GFP/GFP mice compared to control. * (t(13)=2.513; p=0.026; CX3CR1GFP/GFP(n=9) vs. CX3CR1+/GFP (n=6)). The BrdU immunohistochemistry (black staining) is shown in the representative photomicrographs from the CX3CR1+/GFP mice (E) and CX3CR1GFP/GFP mice (F). (G) Confocal photomicrogaph of CX3CR1 (GFP) and DAPI (blue), demonstrate the localization of the CX3CR1 cells in the dentate gyrus. (H) Localization of CX3CR1 (GFP) cells was not found in NeuN+ cells (magenta) or in GFAP+ cells (blue), and only rarely in BrdU+ cells (red). (I) Low power confocal photomicrograph of DCX+ cells (red) and CX3CR1 (GFP) cells are also (J) shown in higher power in maximum projection of confocal z-stack. Arrows indicate CX3CR1 (GFP) cells that are in close proximity to the DCX cells. Video of the z stack used for the maximum projection can be found in the supplementary material.
Figure 2
Figure 2. FKN reverses the age-related decrease in neurogenesis
(A) Timeline: In experiment 1 treatment lasted for 7 days, with injections of BrdU occurring at day 6. In experiment 2, treatment lasted for 14 days, with injections of CldU occurring at day -1 and injections of IdU occurring at day 6. BrdU was used to study the effects of the treatments on proliferation of hippocampal NPC. CldU was used to study the effects of treatment on the cells born prior to the treatment. IdU was used to study the effects of survival of the cells born after treatment and to make direct comparisons with BrdU data. (B) A significant increase in proliferation as measured by the number of BrdU+ cells was found in the aged rats treated with FKN for 6 days. *(t(10)=2.639; p=0.0248; FKN(n=6) vs. HI-FKN(n=6)). (C) After 7 days of FKN treatment in age rats there was no significant difference in the number of DCX+ cells (FKN n=4; HI-FKN n=6). (D) In the second experiment, in the cells born before treatment began (labeled with CldU) with 15 days of time for the labeled cells to survive, no difference was found between groups (FKN n=5; HI-FKN n=4). (E) When cells were labeled with IdU on day 7 (same time point as BrdU (B)) a significant increase (p=0.0065; E) in number of IDU+ cells was found in the FKN treated group. *(t(7)=3.831; p=0.0065; FKN(n=5) vs. HI-FKN(n=4)). (F) After 14 days of treatment in aged rats, FKN significantly increased the number of DCX+ cells. *(t(8)=2.945; p=0.0116; FKN(n=5) vs. HI-FKN(n=5)). (G) The number of IdU+ cells was found to strongly correlate with the number of DCX+. ***(Pearson r=0.933; p=0.0002).
Figure 3
Figure 3. Expression of FKN in the hippocampus
Quantification of protein (A) and mRNA (B) levels of FKN in the hippocampus of young adult and aged rat, demonstrated a significant decrease in protein levels of FKN, but not in mRNA levels (n=6 per group). *(t(10)=2.436; p=0.0351; 3 Mo. old(n=6) vs. 12 Mo. old(n=6)).**(t(10)=4.130; p=0.002; 12 Mo. old(n=6) vs. 22 Mo. old(n=6)).***(t(10)=5.190; p=0.0004; 3 Mo. old(n=6) vs. 22 Mo. old(n=6)). (C) FKN expression (green) was not found on Tuj1+ (red) cells, but was expressed on the majority of the cells (DAPI: blue) in the GCL. (D–G) FKN expression (green) was found on the mature neurons labeled with NeuN (blue) but not on the BrdU+ cells (red) in rats one day post injection with BrdU, as seen in the merged figure (G). (H) Shows a high magnification photomicrogaph of Ki-67 staining (red) and FKN staining (green), with DAPI (blue). Similar to the Tuj1+ cells and BrdU+ cells, the Ki-67+ cells also lack FKN expression.
Figure 4
Figure 4. CX3CR1 blocking antibody increases hippocampal IL-1β levels
In 3 month old male rats treated for 28 days with the blocking antibody we found a significant increase in IL-1β protein levels compared to non-immune IgG or saline control animals. (††p=0.0023 saline vs. IgG) (***p=0.0003 saline vs. α-CX3CR1) (*p=0.039 IgG vs. α-CX3CR1) (Saline n=8; IgG n=4; α-CX3CR1 n=5).
Figure 5
Figure 5. IL-1Ra reverses the effects of α-CX3CR1
To determine if the decrease neurogenesis caused by blocking antibody to α-CX3CR1 was mediated by IL-1β we infused IL-1Ra along with the blocking antibody for 7 days of treatment. On day 6, young adults rat were injected with BrdU. Gray bars are the groups that received heat-inactivated IL-1Ra. White bars are groups that received active IL-1Ra. (A) In the α-CX3CR1/HI-IL-1ra group, there was significantly fewer BrdU+ cells then the three other groups which were not different from each other. (B) IL-1ra blocked the decrease in DCX+ cells caused by α-CX3CR1. In the non-immune IgG group IL-1Ra (white) caused a significant decrease in the number of DCX+ cells compared to the IL-1Ra inactive control (grey). (C) A representative photomicrograph of the BrdU (green) and DCX (red) double labeling. The white arrows point to the BrdU+ cells in the SGZ. (D) Orthogonal view of the confocal z-stack of BrdU+ DCX+ cells. Following the 14 day infusion paradigm (see Fig.2A), (E) we found a significant decrease in the number of CldU+ cells which were born the day before we started infusion in the α-CX3CR1. * (t(7)=3.566; p=0.0091; IgG (n=5) vs. α-CX3CR1 (n=4)). (F) In the 14 day experiment, a significant decrease was also found in the number of IdU+ cells. * (t(7)=2.506; p=0.0406; IgG (n=5) vs. α-CX3CR1 (n=4)). (G) Quantification of the number of DCX+ cells also demonstrated a significant decrease following treatment with α-CX3CR1. * (t(7)=2.690; p=0.0311; IgG (n=5) vs. α-CX3CR1 (n=4)).
Figure 6
Figure 6. FKN signaling regulates microglia activation
Quantification of the number of OX-6+ cell, which is a marker for MHC class II, (A) we found in the rats that received the blocking antibody with an inactive IL-1Ra (gray) a significant increase in the number of OX-6+ cells compared to the two non-immune IgG groups. (B) After 14 days of blocking antibody treatment in the young rats a significant increase in the number of OX-6+ cells was found in the young α-CX3CR1 treated rats (n=5) compared to the non-immune IgG treated rats (n=5). * (t(8)=2.653; p=0.0291; IgG (n=5) vs. α-CX3CR1 (n=5)). (C) In the aged rats after 14 days of treatment with FKN significantly decreased the number of OX-6+ cells. * (t(8)=3.030; p=0.0163; HI-FKN (n=6) vs. FKN (n=4)). (D) The number of OX-6+ cells was also found to significantly correlate with the number of IDU+ cells * (Pearson r(9)=−0.7425; p=0.0219).

References

    1. Aloisi F. Immune function of microglia. Glia. 2001;36:165–179. - PubMed
    1. Bachstetter AD, Pabon MM, Cole MJ, Hudson CE, Sanberg PR, Willing AE, Bickford PC, Gemma C. Peripheral injection of human umbilical cord blood stimulates neurogenesis in the aged rat brain. BMC Neurosci. 2008;9:22. - PMC - PubMed
    1. Ben Abdallah NM, Slomianka L, Vyssotski AL, Lipp HP. Early age-related changes in adult hippocampal neurogenesis in C57 mice. Neurobiol Aging. 2008 - PubMed
    1. Biber K, Neumann H, Inoue K, Boddeke HW. Neuronal 'On' and 'Off' signals control microglia. Trends Neurosci. 2007;30:596–602. - PubMed
    1. Cardona AE, Pioro EP, Sasse ME, Kostenko V, Cardona SM, Dijkstra IM, Huang D, Kidd G, Dombrowski S, Dutta R, Lee JC, Cook DN, Jung S, Lira SA, Littman DR, Ransohoff RM. Control of microglial neurotoxicity by the fractalkine receptor. Nat Neurosci. 2006;9:917–924. - PubMed

Publication types