. 2010 Feb;36(2):250-67.
doi: 10.1016/j.ultrasmedbio.2009.09.010. Epub 2009 Dec 16.

Shock-induced heating and millisecond boiling in gels and tissue due to high intensity focused ultrasound

Affiliations

Shock-induced heating and millisecond boiling in gels and tissue due to high intensity focused ultrasound

Michael S Canney et al. Ultrasound Med Biol. 2010 Feb.

Abstract

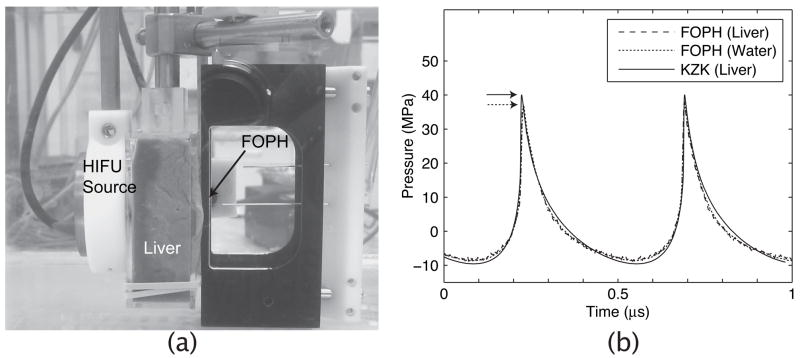
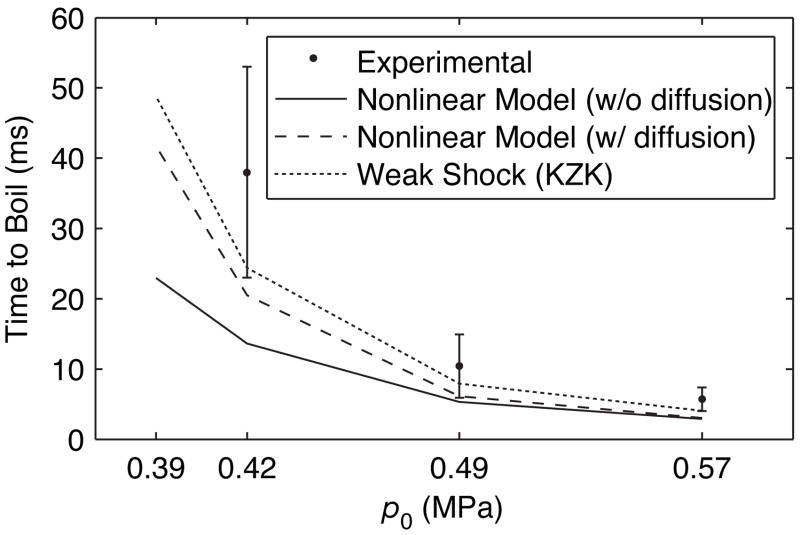
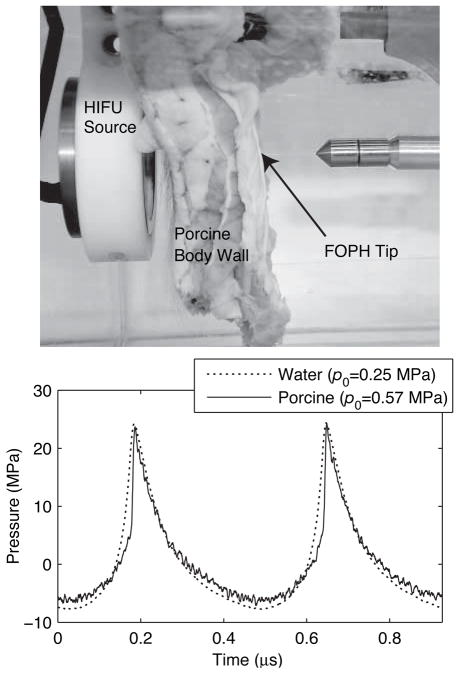
Nonlinear propagation causes high-intensity ultrasound waves to distort and generate higher harmonics, which are more readily absorbed and converted to heat than the fundamental frequency. Although such nonlinear effects have been investigated previously and found to not significantly alter high-intensity focused ultrasound (HIFU) treatments, two results reported here change this paradigm. One is that at clinically relevant intensity levels, HIFU waves not only become distorted but form shock waves in tissue. The other is that the generated shock waves heat the tissue to boiling in much less time than predicted for undistorted or weakly distorted waves. In this study, a 2-MHz HIFU source operating at peak intensities up to 25,000 W/cm(2) was used to heat transparent tissue-mimicking phantoms and ex vivo bovine liver samples. Initiation of boiling was detected using high-speed photography, a 20-MHz passive cavitation detector and fluctuation of the drive voltage at the HIFU source. The time to boil obtained experimentally was used to quantify heating rates and was compared with calculations using weak shock theory and the shock amplitudes obtained from nonlinear modeling and measurements with a fiber optic hydrophone. As observed experimentally and predicted by calculations, shocked focal waveforms produced boiling in as little as 3 ms and the time to initiate boiling was sensitive to small changes in HIFU output. Nonlinear heating as a result of shock waves is therefore important to HIFU, and clinicians should be aware of the potential for very rapid boiling because it alters treatments.


Figures

Figure 1
Figure 1
A diagram of the experimental arrangement used for observing initiation of boiling in tissue-mimicking transparent gel phantoms and ex vivo liver samples.
Figure 2
Figure 2
Measurement and modeling of the acoustic field of the 2-MHz HIFU source in a tissue-mimicking gel phantom containing 7% w/v BSA at two different output levels: p0=0.048 MPa (IL=144 W/cm2, IN =145 W/cm2) and p0=0.44 MPa (IL=12,000 W/cm2, IN =16,700 W/cm2). (a) Focal waveforms measured using the FOPH and simulated using the KZK model. (b, c) Simulated 2D axial distributions of peak positive and negative pressures, heating, and intensity for an output level where propagation is nearly linear (p0=0.048 MPa); and for an output level where shocks are formed at the focus (p0=0.44 MPa). The contours in the 2D distributions depict the −1, −3, and −6 dB regions of each plotted variable.
Figure 3
Figure 3
Peak focal heating rates in gel phantom modeled assuming either linear or nonlinear propagation and calculated using weak shock theory from the modeled and measured focal waveforms. In addition, the peak focal waveforms predicted using the nonlinear model for output levels corresponding to p0=0.24 MPa, p0=0.30 MPa, and p0=0.34 MPa are shown at the top of the figure. A moderate increase in focal heating relative to the linearly predicted heating is observed up until the output where shocks begin to form (p0=0.30 MPa), at which point the heating rate increases dramatically to a maximum enhancement of 83 times linear predictions.
Figure 4
Figure 4
Observations of cavitation and boiling in a 7% BSA gel phantom. The frames were recorded after (a) 1 ms, (b) 5 ms, and (c) 9 ms of heating at an output level of p0=0.44 MPa (IL=12,000 W/cm2, IN =16,700 W/cm2). Boiling occurred after 9 ms of heating and is visible by the formation of a large, millimeter-sized bubble at the focus. In addition, Fig. 4a is combined with an overlay of the simulated 2D axial pressure distributions. The innermost ellipse (dashed curve) indicates the −6 dB region of the peak positive pressure, which also corresponds to the region within the focus where the heating rates are the highest. The contour plots for the peak negative pressure levels of −3 MPa and −6 MPa (solid curves) correspond to the range of cavitation thresholds measured in the gel. Cavitation and boiling bubbles in transparent gel are visually distinct in size and location. Onset of boiling is observed at the focus of the HIFU source, while cavitation bubbles are observed over a much larger region prefocally.
Figure 5
Figure 5
Selected high-speed movie frames from two separate experiments depicting initiation of boiling in a 7% BSA gel phantom at an output level of p0=0.57 MPa (IL=20,000 W/cm2, IN =25,500 W/cm2). In the first experiment (a), visible bubble nuclei appear before boiling and boiling occurs in 3.90 ms. In the second experiment (b), no visible nuclei are seen, implying that boiling started from smaller nuclei than in (a) and boiling occurred after 4.25 ms.
Figure 6
Figure 6
Experimental observations during 500 ms of HIFU insonation at an output level of p0=0.34 MPa (IL=7,300 W/cm2, IN =9,600 W/cm2) and 30 ms at p0=0.57 MPa (IL=20,000 W/cm2, IN =25,500 W/cm2) in a gel phantom. The figures on the left of each set show the RMS voltage of the 20-MHz PCD detector [top] and the corresponding spectrogram during the heating [bottom]. The pictures on the right at each power level show the observations from the high-speed video camera at the HIFU focus, filming at 20,000 fps, at selected time points during insonation. At the lower power exposure, boiling occurs at 240 ms of HIFU heating as indicated by the formation of a millimeter-sized bubble at the focus, and also evident by a large increase in signal to the PCD detector. At the higher output level, boiling occurs in 4 ms. Cavitation was detected from the very beginning of insonation, in tens of μs, as broadband noise by the PCD, but was significantly lower in amplitude compared to the signal received when boiling occurred.
Figure 7
Figure 7
[top] Focal waveforms measured and modeled for the lowest (p0=0.39 MPa, IL= 9,400 W/cm2, IN =13,000 W/cm2) and the highest (p0=0.57 MPa, IL=20,000 W/cm2, IN =25,500 W/cm2) output levels where shocks were present at the focus. [bottom] Summary of results from boiling experiments in a 7% BSA gel phantom. The error bars on the high-speed camera data indicate the standard deviation of 5 data points obtained at each source pressure level. The time to boil was calculated from the measured and simulated focal waveforms using weak shock theory, as well as from the full modeling of the nonlinear acoustic field combined with the bioheat equation. No effect of diffusion was observed in modeling results when boiling started in less than 20 ms. At the highest power level, the onset of boiling was detected in less than 4 ms.
Figure 8
Figure 8
(a) Photograph of the experimental arrangement for measurement of focal waveforms in ex vivo bovine liver. (b) Focal waveform measured after propagation through a 27-mm thick sample at p0 = 0.49 MPa (“FOPH (Liver)”) compared with the focal waveform measured in water at p0 = 0.29 MPa (“FOPH (Water)”). By matching experimental focal waveforms obtained in water and behind the liver sample, the attenuation of liver was determined as 1.6 dB/cm at 2.158 MHz. Simulation of the focal waveform in liver (“KZK (Liver)”) using the nonlinear model and experimentally determined attenuation agrees well with the experimental data.
Figure 9
Figure 9
Focal waveforms modeled in liver (solid curves) and derated from simulations in water (dashed curves) for output levels of p0=0.42 MPa, 0.49 MPa, and 0.57 MPa at a depth of 13.5 mm in liver tissue. The peak positive pressures in the derated waveforms were slightly higher than those for the simulations in liver; however, the shock amplitudes As in the corresponding waveforms were equal.
Figure 10
Figure 10
Detection of boiling in 7.5 ms in liver tissue with the HIFU source operating at p0=0.49 MPa (IL=11,400 W/cm2, IN =15,200 W/cm2). The HIFU focus was at a depth of 13.5 mm in the sample. The onset of boiling was observed as fluctuations in the HIFU drive voltage [top] as well as by a large change in the PCD signal amplitude [bottom].
Figure 11
Figure 11
(a) Summary of time to boil in ex vivo bovine liver at three different output levels: p0=0.42 MPa (IL=8,400 W/cm2, IN =11,100 W/cm2), p0=0.49 MPa (IL=11,300 W/cm2, IN =15,200 W/cm2), and p0=0.57 MPa (IL=15,400 W/cm2, IN =20,100 W/cm2). The HIFU focus was at a depth of 13.5 mm in the liver sample. At the highest output level, boiling was observed in as little as 5 ms. Calculations of time to boil agreed well with measurements.
Figure 12
Figure 12
Measurements of the focal waveform through porcine body wall using the FOPH. The HIFU source was operated at p0 = 0.57 MPa. The focal waveform measured after propagation through inhomogeneous tissue agrees well with measurements in water at p0 = 0.25 MPa, which corresponds to a lumped attenuation of 7.2 dB for the tissue path.

References

    1. Bessonova O, Khokhlova V, Bailey M, Canney M, Crum L. Focusing of High Power Ultrasonic Beams and Limiting Values of Shock Wave Parameters. Acoust Phys. 2009;55(4–5):445–456. - PMC - PubMed
    1. Canney M, Khokhlova V, Bailey M, Sapozhnikov O, Crum L. Acoustic characterization of high intensity focused ultrasound fields: A combined measurement and modeling approach. J Acoust Soc Am. 2008;124(4):2406–2420. - PMC - PubMed
    1. Chen W, Lafon C, Matula T, Vaezy S, Crum L. Mechanisms of Lesion Formation in High Intensity Focused Ultrasound Therapy. IEEE Ultrason Symposium. 2002;2:8–11.
    1. Clarke R, ter Haar G. Production of harmonics in vitro by high-intensity focused ultrasound. Ultrasound Med Biol. 1999;25(9):1417–1424. - PubMed
    1. Clement G, McDannold N, Hynynen K, editors. Therapeutic Ultrasound: 5th International Symposium on Therapeutic Ultrasound. Boston, MA. October 27–29, 2005; AIP Conference Proceedings; 2005.

Publication types