. 2010 Jan 15;184(2):877-85.
doi: 10.4049/jimmunol.0902346. Epub 2009 Dec 14.

Mice with a selective impairment of IFN-gamma signaling in macrophage lineage cells demonstrate the critical role of IFN-gamma-activated macrophages for the control of protozoan parasitic infections in vivo

Affiliations

Mice with a selective impairment of IFN-gamma signaling in macrophage lineage cells demonstrate the critical role of IFN-gamma-activated macrophages for the control of protozoan parasitic infections in vivo

Jennifer E Lykens et al. J Immunol. .

Abstract

IFN-gamma has long been recognized as a cytokine with potent and varied effects in the immune response. Although its effects on specific cell types have been well studied in vitro, its in vivo effects are less clearly understood because of its diverse actions on many different cell types. Although control of multiple protozoan parasites is thought to depend critically on the direct action of IFN-gamma on macrophages, this premise has never been directly proven in vivo. To more directly examine the effects of IFN-gamma on cells of the macrophage lineage in vivo, we generated mice called the "macrophages insensitive to IFN-gamma" (MIIG) mice, which express a dominant negative mutant IFN-gamma receptor in CD68+ cells: monocytes, macrophages, dendritic cells, and mast cells. Macrophage lineage cells and mast cells from these mice are unable to respond to IFN-gamma, whereas other cells are able to produce and respond to this cytokine normally. When challenged in vitro, macrophages from MIIG mice were unable produce NO or kill Trypanosoma cruzi or Leishmania major after priming with IFN-gamma. Furthermore, MIIG mice demonstrated impaired parasite control and heightened mortality after T. cruzi, L. major, and Toxoplasma gondii infection, despite an appropriate IFN-gamma response. In contrast, MIIG mice displayed normal control of lymphocytic choriomeningitis virus, despite persistent insensitivity of macrophages to IFN-gamma. Thus, the MIIG mouse formally demonstrates for the first time in vivo, the specific importance of direct, IFN-gamma mediated activation of macrophages for controlling infection with multiple protozoan parasites.


Figures
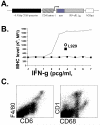
Figure 1
Figure 1. Development of MIIG transgenic mice
A. Diagram of the MIIG transgenic construct; a CD68 promoter/intron fragment was combined with a myc-tagged, dominant negative, mutant IFN-γ receptor 1 chain, which has a truncation of the cytoplasmic signaling portion. B. This promoter/gene construct was tested by transfection into L929 cells. Upregulation of MHC class I (Kk) in response to increasing amounts of IFN-γ was measured in transduced and non-transduced cells. C. Flow cytometric analysis of murine spleen cells reveals that CD68 protein is highly expressed in macrophages and to a lesser degree in CD11chigh (dendritic) cells.
Figure 2
Figure 2. Expression of the MIIG transgene and responsiveness to IFN-γ in macrophage/monocyte populations from WT and MIIG mice
A. Dots plots illustrating how each population is defined by flow cytometry. BMDM indicates bone marrow derived macrophages, after culture with M-CSF. B. Cell surface myc staining of indicated populations. C. Phospho-STAT1 staining of the indicated population after in vitro stimulation with IFN-γ. D. Phospho-STAT1 staining of peritoneal macrophages after stimulation with IFN-α. E. IL-12p40 and IL-10 production by BMDM’s from WT and MIIG mice after stimulation with titrated amounts of either CpG (ODN 1826) or LPS. Shaded area represents isotype staining (in B) or fluorescence intensity of phospho-STAT1 in unstimulated cells (in C and D). Data are representative of three or more experiments examining greater than 6 mice.
Figure 3
Figure 3. Expression of the MIIG transgene and responsiveness to IFN-γ in dendritic cell populations from WT and MIIG mice
A. Dots plots illustrating how each population is defined by flow cytometry. GMDC and FLDC indicate bone marrow derived dendritic cells after culture with GM-CSF or FLT3 ligand, respectively. B. Cell surface myc staining of indicated populations. C. Phospho-STAT1 staining of the indicated population after in vitro stimulation with IFN-γ. Shaded area represents isotype staining (in B) or fluorescence intensity of phospho-STAT1 in unstimulated cells (in C). Data are representative of three or more experiments examining greater than 6 mice.
Figure 4
Figure 4. Cell type specific expression of the MIIG transgene and responsiveness to IFN-γ in non-macrophage lineage cells from WT and MIIG mice
A. Dots plots illustrating how each population is defined by flow cytometry. B. Surface myc staining of indicated populations. C. Phospho-STAT1 staining of the indicated population after in vitro stimulation with IFN-γ. Shaded area represents isotype staining (in B) or fluorescence intensity of phospho-STAT1 in unstimulated cells (in C). D. Expression of the MIIG transgene and β-actin in indicated tissues, as measured by RT PCR of cDNA. Non-hematopoietic tissues were first depleted of CD45+ cells before extraction of RNA, in order to avoid contamination by macrophages. Data are representative of three or more experiments examining greater than 6 mice.
Figure 5
Figure 5. Macrophages from MIIG mice are unable to kill intracellular parasites or produce nitric oxide in response to IFN-γ
A. Bone marrow derived macrophages were infected with T. cruzi (Trypo) and treated as indicated. NO production and clearance of T. cruzi infection was measured at 48 hours. B. Peritoneal macrophages were infected with L. major and cultured as indicated. NO production was measured at 72 hours. Images (600X) of L. major infected macrophages +/− IFN-γ/LPS treatment at 96 hours, with numerous visible parasites. *=p<0.01 comparing MIIG and WT macrophages treated in the same fashion. n=3 animals, with all studies repeated at least twice.
Figure 6
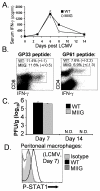
Figure 6. MIIG mice mount a normal response to LCMV and clear the infection despite persistent unresponsiveness of macrophages to IFN-γ
A. MIIG and WT mice were infected with LCMV and bled serially at the indicated time points in order to assess serum IFN-γ levels by ELISA n=6/group B. CD8 and CD4 T cell responses were quantitated at day 7 by intracellular cytokine staining. Percentages shown represent the percent of splenic CD8 or CD4 T cells, respectively, responding to the indicated peptide epitope. C. Quantitation of LCMV viral burden by standard plaque assay at the indicated days after infection. N.D. indicates none detected; pfu indicates plaque forming units. D. Phospho-STAT1 staining of peritoneal macrophages directly ex vivo (without further in vitro stimulation), 7 days after LCMV infection. n=4 animals (except where indicated), with all studies repeated at least twice.
Figure 7
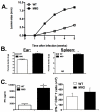
Figure 7. MIIG mice display impaired control of T. cruzi and T. gondii infection despite an appropriate IFN-γ response to T. gondii
A. Parasite burden and survival were measured after infection of WT and MIIG mice with T. cruzi. n=6/group B. Parasite burden and survival was assessed after T. gondii infection of WT and MIIG mice. Parasitic infection of peritoneal macrophages was quantitated by microscopic examination of cytospin preparations. C. Serum IFN-γ was measured by ELISA, 7 days after infection with T. gondii. n=4/group
Figure 8
Figure 8. MIIG mice fail to control L. major infection despite an appropriate IFN-γ response
A. WT and MIIG mice were infected intradermally with L. major and lesion size was measured serially. B. Parasite burden was quantitated in the indicated tissues 5 weeks after infection. C. IFN-γ production was measured in vivo by a cytokine capture assay (5 weeks after infection) and by intracellular cytokine staining of CD4+ T cells from the draining lymph nodes (3 weeks after infection). *=p<0.01, ND= not detected, n=6/group

Similar articles

Cited by

References

    1. Bach EA, Aguet M, Schreiber RD. The IFN gamma receptor: a paradigm for cytokine receptor signaling. Annu Rev Immunol. 1997;15:563–591. - PubMed
    1. Pestka S, Krause CD, Walter MR. Interferons, interferon-like cytokines, and their receptors. Immunol Rev. 2004;202:8–32. - PubMed
    1. Strehl B, Seifert U, Kruger E, Heink S, Kuckelkorn U, Kloetzel PM. Interferon-gamma, the functional plasticity of the ubiquitin-proteasome system, and MHC class I antigen processing. Immunol Rev. 2005;207:19–30. - PubMed
    1. Muhl H, Pfeilschifter J. Anti-inflammatory properties of pro-inflammatory interferon-gamma. Int Immunopharmacol. 2003;3:1247–1255. - PubMed
    1. Badovinac VP, Tvinnereim AR, Harty JT. Regulation of antigen-specific CD8+ T cell homeostasis by perforin and interferon-gamma. Science. 2000;290:1354–1358. - PubMed

Publication types