. 2010 Jan 5;107(1):204-9.
doi: 10.1073/pnas.0903158107. Epub 2009 Dec 14.

Homeostatic imbalance of regulatory and effector T cells due to IL-2 deprivation amplifies murine lupus

Affiliations

Homeostatic imbalance of regulatory and effector T cells due to IL-2 deprivation amplifies murine lupus

Jens Y Humrich et al. Proc Natl Acad Sci U S A. .

Abstract

The origins and consequences of a regulatory T cell (Treg) disorder in systemic lupus erythematosus (SLE) are poorly understood. In the (NZBxNZW) F(1) mouse model of lupus, we found that CD4(+)Foxp3(+) Treg failed to maintain a competitive pool size in the peripheral lymphoid organs resulting in a progressive homeostatic imbalance of CD4(+)Foxp3(+) Treg and CD4(+)Foxp3(-) conventional T cells (Tcon). In addition, Treg acquired phenotypic changes that are reminiscent of IL-2 deficiency concomitantly to a progressive decline in IL-2-producing Tcon and an increase in activated, IFN-gamma-producing effector Tcon. Nonetheless, Treg from lupus-prone mice were functionally intact and capable to influence the course of disease. Systemic reduction of IL-2 levels early in disease promoted Tcon hyperactivity, induced the imbalance of Treg and effector Tcon, and strongly accelerated disease progression. In contrast, administration of IL-2 partially restored the balance of Treg and effector Tcon by promoting the homeostatic proliferation of endogenous Treg and impeded the progression of established disease. Thus, an acquired and self-amplifying disruption of the Treg-IL-2 axis contributed essentially to Tcon hyperactivity and the development of murine lupus. The reversibility of this homeostatic Treg disorder provides promising approaches for the treatment of SLE.


Conflict of interest statement

The authors declare no conflict of interest.

Figures

Fig. 1.
Fig. 1.
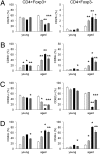
Progressive homeostatic imbalance of Treg and Tcon. (A and B) Average percentage of Foxp3+ cells among CD4+ and among CD4 SP T cells (A) and absolute numbers (B) of CD4+Foxp3+ T cells in spleens (SN), lymph nodes (LN), peripheral blood (PB), and of CD4 SP Foxp3+ T cells in thymi (TH) from (NZBxNZW) F1 mice (filled bars) at the indicated disease stages compared to age-matched BALB/c mice (open bars) determined by flow cytometry. Data represent the mean of 6–10 mice per group from two to three independent experiments with three to four mice per group. (C) Calculated ratios of the percentage of BrdU+ cells among CD4+Foxp3+ and CD4+Foxp3 cells from (NZBxNZW) F1 (filled bars) compared to age-matched BALB/c mice (open bars) in the indicated organs and at the indicated disease stages. Data represent the mean of 3–10 mice per group from one to three independent experiments with two to four mice per group. Error bars indicate SEM (*, P < 0.05; **, P < 0.01; ***, P < 0.001 vs. BALB/c).
Fig. 2.
Fig. 2.
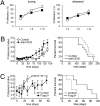
Phenotypic changes of Treg and Tcon during disease progression. Average expression of CD25 (A), CD69 (B), CD62L (C), and CD44 (D) on CD4+Foxp3+- and CD4+Foxp3-gated cells from spleens of BALB/c (white bars), NZW (light gray bars), NZB (black bars), and (NZBxNZW) F1 mice (dark gray bars) at the age of 8–10 weeks (young) or 6–9 months (aged), respectively. Data were determined by flow cytometry and represent the mean of 3–10 mice per group from one to three independent experiments with three to four mice per group. Error bars indicate SEM (*, P < 0.05; **, P < 0.01; ***, P < 0.001 vs. BALB/c).
Fig. 3.
Fig. 3.
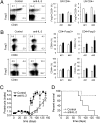
Decline in IL-2-producing CD4+ T cells. Representative dot plots show the percentage of IL-2- and IFN-γ-producing cells among CD4+-gated spleen (A) and lymph node (B) cells from 6- to 9-month-old BALB/c and diseased (NZBxNZW) F1 mice (NZBW). Numbers in quadrants indicate the percentage of the designated population. The respective bar diagrams show the average percentage of IL-2+ and IFN-γ+ cells among CD4+ T cells from (NZBxNZW) F1 mice (filled bars) during disease progression compared to age-matched BALB/c mice (open bars). Data represent the mean of three to six mice per group from one to two independent experiments with three mice per group. (CE) Bar diagrams show IL-2 concentrations determined by ELISA from supernatants of spleen (C) and lymph node cells (D) cultured for 24 h and from plasma (E) of (NZBxNZW) F1 mice (filled bars) at the indicated disease stages compared to age-matched BALB/c mice (open bars). Data represent the mean of four to five mice per group. Error bars indicate SEM (*, P < 0.05; **, P < 0.01 vs. BALB/c).
Fig. 4.
Fig. 4.
Treg are functionally intact and influence disease progression. (A) In vitro suppression assays compare the suppressive capacity of CD4+CD25+ Treg from (NZBxNZW) F1 and age-matched BALB/c mice. The proliferation of CFDA-SE-labeled responder cells in the presence of titrated numbers of Treg was analyzed by flow cytometry and is presented in percent of the proliferation of responder cells without Treg (taken as 100%). Error bars indicate SD from triplicate cultures. One representative of two to three independent experiments is shown. (B) Nephritis development, presented as average proteinuria score, and survival, presented as Kaplan–Meier curves (P = 0.116; n = 10 per group), after injection of depleting antibodies against CD25 (anti-CD25) into 8- to 10-week-old, clinically healthy (NZBxNZW) F1 mice compared to rat IgG1-treated controls (Control). (D) Average proteinuria score and survival (P = 0.0439) after adoptive transfer of 5 × 10⁵ activated CD4+CD25+Foxp3+ cells into diseased (NZBxNZW) F1 mice at the age of 6.5 months (Foxp3+) compared to a PBS-treated control group (Control). One of two independent experiments is shown (n = 5 per group). (B and C) Error bars indicate SEM.
Fig. 5.
Fig. 5.
IL-2 neutralization induces Treg:Tcon imbalance and accelerates disease. (A and B) Flow cytometry of CD4+-gated T cells 21 and 42 days after injection of anti-IL-2 antibodies (anti-IL-2; filled bars) into 9- to 10-week-old, clinically healthy (NZBxNZW) F1 mice compared to rat IgG-treated controls (Control; open bars). Representative dot plots show the percentage of CD25+ (A) and of CD69+ and CD44+ (B) cells among Foxp3+ and Foxp3 cells in spleens 42 days after IL-2 neutralization. Numbers in quadrants indicate the percentage of the designated population. Bar diagrams show the average percentage of Foxp3+CD25+ cells among CD4+ T cells in spleens (SN) and lymph nodes (LN) and of CD69+ and CD44+ cells among CD4+Foxp3+ and CD4+Foxp3 cells in spleens. Data represent the mean + SD (n = 3 per group and time point). (C and D) Nephritis development (C) and survival (D) after injection of 1 mg of neutralizing anti-IL-2 antibodies (anti-IL-2) into young, clinically healthy (NZBxNZW) F1 mice compared to rat IgG-treated controls (Control); nephritis development is presented as average proteinuria score and survival as Kaplan–Meier curves (P = 0.0197). One representative of two independent experiments is shown (n = 5 per group). Error bars indicate SEM.
Fig. 6.
Fig. 6.
rIL-2 restores Treg:Tcon balance and impedes disease progression. (A) Flow cytometry of CD4+ T cells from spleens of 5-month-old (NZBxNZW) F1 mice 12 h after three injections of 2 μg of rIL-2 per mouse within 24 h (rIL-2) compared to PBS-treated mice (Control). Representative dot plots show the percentage of CD25+ and Foxp3+ cells among CD4+-gated T cells. Bar diagrams show the average percentage of the indicated parameters within the respective population (mean + SD; n = 3 per group). (B) Representative dot plots and bar diagrams show the percentage of BrdU+ cells among CD4+Foxp3+ T cells in spleens from 7.5 month old (NZBxNZW) F1 mice (filled bars) compared to age-matched BALB/c mice (open bars) 4 days after a 24-h treatment with rIL-2 and daily injections of BrdU. The calculated ratio of the percentage BrdU+ cells among CD4+Foxp3+ and CD4+Foxp3 cells from controls (open bar) and rIL-2-treated (NZBxNZW) F1 mice (filled bar) is compared in a bar diagram. Data represent the mean of three to eight mice per group from one to three independent experiments (*, P < 0.05; **, P < 0.01 vs. control). Numbers in quadrants indicate the percentage in the designated population. (C and D) Nephritis development, presented as average proteinuria score (C), and survival, presented as Kaplan–Meier curves (D) (P = 0.0035) after repetitive treatment of 6.3-month-old, diseased (NZBxNZW) F1 mice with 2 μg of rIL-2 per mouse every 5 days for a total of four times (until day 20) after an initial short-term treatment with three injections of 2 μg of rIL-2 per mouse within 24 h (rIL-2) compared to an aged-matched PBS-treated control group (Control) (n = 8 per group). Error bars indicate SEM.

References

    1. Fontenot JD, Gavin MA, Rudensky AY. Foxp3 programs the development and function of CD4+CD25+ regulatory T cells. Nat Immunol. 2003;4:330–336. - PubMed
    1. Sakaguchi S. Naturally arising Foxp3-expressing CD25+CD4+ regulatory T cells in immunological tolerance to self and non-self. Nat Immunol. 2005;6:345–352. - PubMed
    1. Kim JM, Rasmussen JP, Rudensky AY. Regulatory T cells prevent catastrophic autoimmunity throughout the lifespan of mice. Nat Immunol. 2007;8:191–197. - PubMed
    1. Costantino CM, Baecher-Allan CM, Hafler DA. Human regulatory T cells and autoimmunity. Eur J Immunol. 2008;38:921–924. - PMC - PubMed
    1. Malek TR. The biology of interleukin-2. Annu Rev Immunol. 2008;26:453–479. - PubMed

Publication types