

Evolution in health and medicine Sackler colloquium: a public choice framework for controlling transmissible and evolving diseases
- PMID: 20018681
- PMCID: PMC2868281
- DOI: 10.1073/pnas.0906078107
Evolution in health and medicine Sackler colloquium: a public choice framework for controlling transmissible and evolving diseases
Abstract
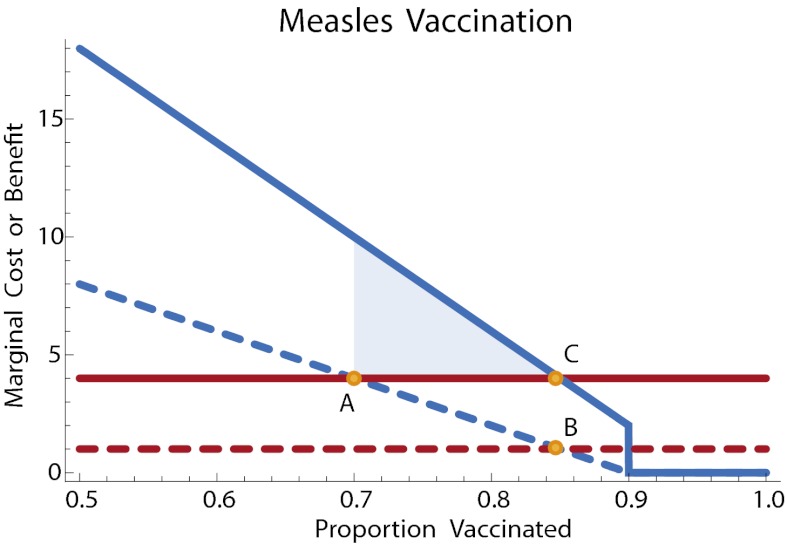
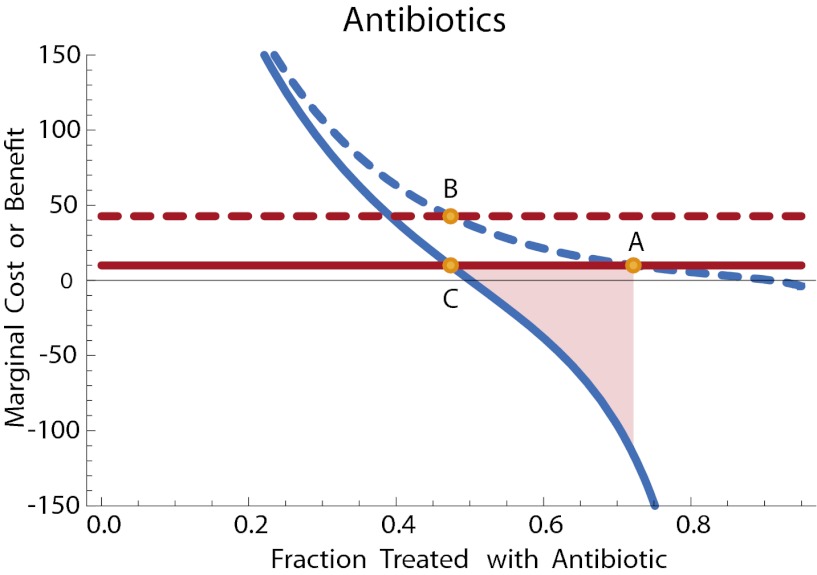
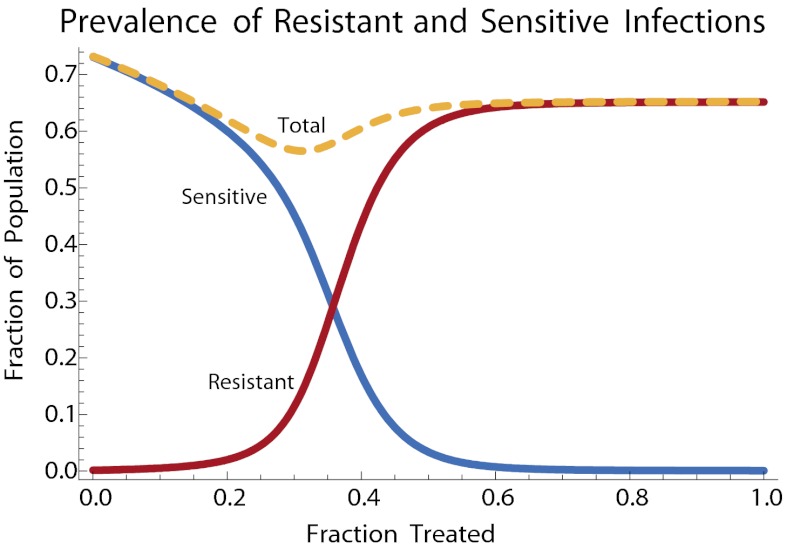
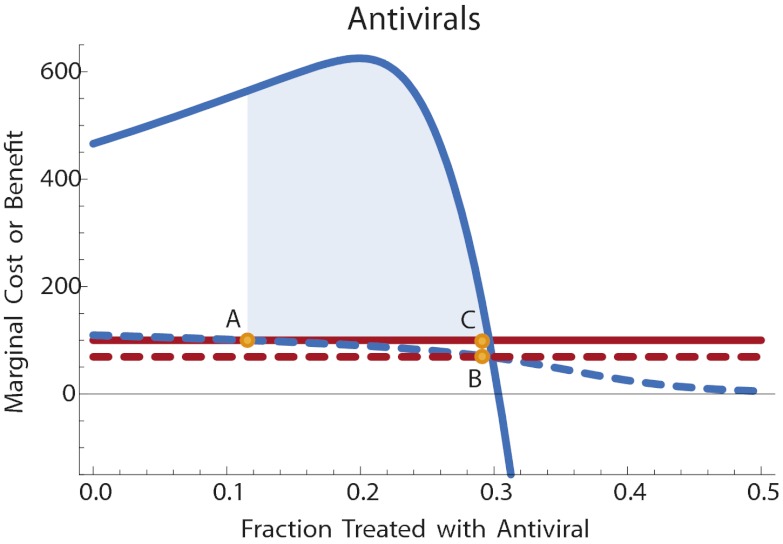
Control measures used to limit the spread of infectious disease often generate externalities. Vaccination for transmissible diseases can reduce the incidence of disease even among the unvaccinated, whereas antimicrobial chemotherapy can lead to the evolution of antimicrobial resistance and thereby limit its own effectiveness over time. We integrate the economic theory of public choice with mathematical models of infectious disease to provide a quantitative framework for making allocation decisions in the presence of these externalities. To illustrate, we present a series of examples: vaccination for tetanus, vaccination for measles, antibiotic treatment of otitis media, and antiviral treatment of pandemic influenza.
Conflict of interest statement
The authors declare no conflict of interest.
Figures
Similar articles
-
Adult immunizations: are they worth the trouble?J Gen Intern Med. 1990 Sep-Oct;5(5 Suppl):S57-61. doi: 10.1007/BF02600844. J Gen Intern Med. 1990. PMID: 2231067
-
[Eradication of infectious diseases by vaccination].Med Trop (Mars). 2007 Aug;67(4):321-7. Med Trop (Mars). 2007. PMID: 17926788 French.
-
[Certain results of infectious disease prevention in the German Democratic Republic].Zh Mikrobiol Epidemiol Immunobiol. 1979 Nov;(11):62-7. Zh Mikrobiol Epidemiol Immunobiol. 1979. PMID: 117653 Russian.
-
Influenza virus vaccines in children and their impact on the incidence of otitis media.Semin Pediatr Infect Dis. 2002 Apr;13(2):129-33. doi: 10.1053/spid.2002.123000. Semin Pediatr Infect Dis. 2002. PMID: 12122951 Review.
-
[Contribution of simulation models to public health decisions: the influenza pandemic].Med Mal Infect. 2007 Dec;37 Suppl 3:S204-9. doi: 10.1016/j.medmal.2007.02.004. Epub 2007 Nov 26. Med Mal Infect. 2007. PMID: 18031963 Review. French.
Cited by
-
Containment efficiency and control strategies for the corona pandemic costs.Sci Rep. 2021 Mar 25;11(1):6848. doi: 10.1038/s41598-021-86072-x. Sci Rep. 2021. PMID: 33767222 Free PMC article.
-
Evolutionary medicine: its scope, interest and potential.Proc Biol Sci. 2012 Nov 7;279(1746):4305-21. doi: 10.1098/rspb.2012.1326. Epub 2012 Aug 29. Proc Biol Sci. 2012. PMID: 22933370 Free PMC article. Review.
-
Past evolutionary tradeoffs represent opportunities for crop genetic improvement and increased human lifespan.Evol Appl. 2011 Mar;4(2):216-24. doi: 10.1111/j.1752-4571.2010.00158.x. Epub 2010 Oct 12. Evol Appl. 2011. PMID: 25567969 Free PMC article.
-
Interaction of Vaccination and Reduction of Antibiotic Use Drives Unexpected Increase of Pneumococcal Meningitis.Sci Rep. 2015 Jun 11;5:11293. doi: 10.1038/srep11293. Sci Rep. 2015. PMID: 26063589 Free PMC article.
-
Feedback Between Behavioral Adaptations and Disease Dynamics.Sci Rep. 2018 Aug 20;8(1):12452. doi: 10.1038/s41598-018-30471-0. Sci Rep. 2018. PMID: 30127447 Free PMC article.
References
-
- Brito DL, Sheshinski E, Intriligator MD. Externalities and compulsory vaccinations. J Public Econ. 1991;45:69–90.
-
- Geoffard P-Y, Philipson T. Disease eradication: Private versus public vaccination. Am Econ Rev. 1997;87:222–230.
-
- Francis PJ. Dynamic epidemiology and the market for vaccinations. J Public Econ. 1997;63:383–406.
-
- Gersovitz M, Hammer JS. Infectious diseases, public policy, and the marriage of economics and epidemiology. World Bank Res Obs. 2003;18:129–157.
-
- Gersovitz M, Hammer JS. The economic control of infectious diseases. Econ J. 2004;114:1–27.
Publication types
MeSH terms
Grants and funding
LinkOut - more resources
Full Text Sources
Other Literature Sources
