. 2010 Jan 5;107(1):216-21.
doi: 10.1073/pnas.0909541107. Epub 2009 Dec 14.

Effective collaboration between marginal metallophilic macrophages and CD8+ dendritic cells in the generation of cytotoxic T cells

Affiliations

Effective collaboration between marginal metallophilic macrophages and CD8+ dendritic cells in the generation of cytotoxic T cells

Ronald Backer et al. Proc Natl Acad Sci U S A. .

Abstract

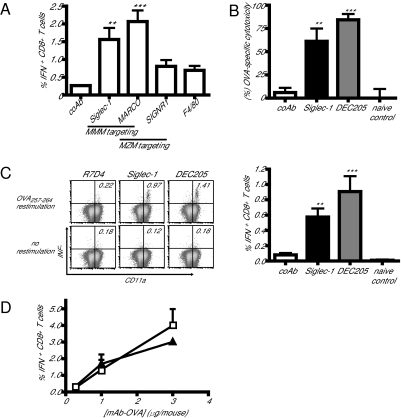
The spleen is the lymphoid organ that induces immune responses toward blood-borne pathogens. Specialized macrophages in the splenic marginal zone are strategically positioned to phagocytose pathogens and cell debris, but are not known to play a role in the activation of T-cell responses. Here we demonstrate that splenic marginal metallophilic macrophages (MMM) are essential for cross-presentation of blood-borne antigens by splenic dendritic cells (DCs). Our data demonstrate that antigens targeted to MMM as well as blood-borne adenoviruses are efficiently captured by MMM and exclusively transferred to splenic CD8(+) DCs for cross-presentation and for the activation of cytotoxic T lymphocytes. Depletion of macrophages in the marginal zone prevents cytotoxic T-lymphocyte activation by CD8(+) DCs after antibody targeting or adenovirus infection. Moreover, we show that tumor antigen targeting to MMM is very effective as antitumor immunotherapy. Our studies point to an important role for splenic MMM in the initial steps of CD8(+) T-cell immunity by capturing and concentrating blood-borne antigens and the transfer to cross-presenting DCs which can be used to design vaccination strategies to induce antitumor cytotoxic T-cell immunity.


Conflict of interest statement

The authors declare no conflict of interest.

Figures

Fig. 1.
Fig. 1.
Ag targeting to MMM results in efficient CD8+ T-cell priming. (A) Evaluation of CD8+ T-cell priming after targeting to splenic Mϕ subsets. Mice were i.v. immunized with 1 μg indicated mAb-OVA together with 25 μg αCD40 mAb. After 7 days, spleen cells were restimulated in vitro for 5 h with the MHC class I OVA257–264 peptide and stained for CD8, CD11a, and intracellular IFNγ. Graphs show the percentage of CD8+CD11a+ T cells producing IFNγ. (B) Mice were injected with the indicated mAb-OVA complexes and, 7 days later, CFSE-labeled OVA257–264-peptide-coated cells were injected intravenously. After 4 h, the cytotoxicity of OVA257–264-peptide-coated cells was analyzed by FACS. (C) Splenocytes were obtained from mice 7 days after immunization with 1 μg indicated mAb-OVA, plus 25 μg αCD40 mAb. Cells were restimulated in vitro and analyzed for OVA-specific IFNγ production. The bar graph indicates average frequency of IFNγ-positive CD8+CD11a+ T cells in mAb-OVA immunized mice. (D) Mice were immunized with a titration of αSiglec-1-OVA (squares) or αDEC205-OVA (triangles). After 7 days, splenocytes were restimulated in vitro. Control mAb-OVA did not result in T-cell IFNγ production above 0.25% for CD8+ T cells. Error bars indicate SEM, n = 5 mice per group. ***P < 0.01, **P < 0.05 versus control mAb-OVA. P values were calculated by one-way ANOVA with Bonferroni correction (GraphPad Prism 4 software).
Fig. 2.
Fig. 2.
CD8+ DCs efficiently cross-present Ag targeted to MMM for induction of CD8+ T-cell responses. (A) Splenic CD11c+ DCs were purified from animals 16 h after i.v. injection with 2.5 μg indicated mAb-OVA + 25 μg αCD40 mAb. Titrated numbers of DCs were cultured together with 105 purified OT-I T cells (black bars; 3 × 10⁵ DCs/well plus 3-fold dilutions in gray and white bars). After 2 days, cultures were pulsed with 1 μCi [3H]thymidine/well. T-cell proliferation was measured after an additional coculture of 16 h. (B) Similarly, CD11c+ DC presentation of in vivo Ag targeted to MMM (anti-Siglec-1), CD8+ (anti-DEC205), or CD8 (anti-DCIR2) DCs was evaluated. (C) To determine whether mAb-OVA complexes, used for targeting Mϕ subsets in vivo, could directly be taken up by DCs, an in vitro Ag-presentation assay was performed. Single-cell suspensions were obtained from mouse spleens and CD11c+ DCs were purified. CD11c+ DCs (105) were cocultured with 10, 3, or 1 μg/mL mAb-OVA, together with purified OT-I T cells, and [3H]thymidine incorporation was determined as described above (10, 3, and 1 μg/mL mAb-OVA are depicted as black, gray, and white bars, respectively). (D) Mice were injected with 2.5 μg/mouse of the indicated mAb-OVA complexes together with 25 μg αCD40 Ab. CD11c+ DCs were isolated after 16 h. CD11chigh CD8 and CD8+ DCs were FACS-sorted from αSiglec-1-OVA immunized mice and tested for their ability to stimulate naive OT-I cells. [3H]Thymidine incorporation was determined as described above. Different bars indicate titration of DCs in the assay [starting at 1 × 10⁵ DCs/well (black bars) with 3-fold dilutions (gray and white bars)]. Error bars indicate SEM of triplicate wells.
Fig. 3.
Fig. 3.
Clodronate depletion of splenic Mϕ and PTx treatment inhibit Ag presentation by DCs and CTL activation after targeting to MMM. Splenic Mϕ were depleted from the spleen by i.v. injection of 200 μL clodronate liposomes. At day 7, spleens were analyzed for depletion of MMM. MMM were stained for Siglec-1 with SER4 (green) and DCs with αCD11c (red). (A) Original magnifications: ×20. (B) Seven days after clodronate liposome treatment, mice were immunized with indicated mAb-OVA complexes. Sixteen hours after immunization, DCs were purified and used as stimulators of naive OT-I T cells in an ex vivo Ag-presentation assay [starting at 3 × 10⁵ DCs/well (black bars) with 3-fold dilutions (gray and white bars)]. (C) Seven days after Cl2MBP liposome treatment, animals were immunized with 2.5 μg of indicated mAb-OVA and, after 7 days, in vivo killing of OVA-loaded CFSE-labeled cells was analyzed by FACS. (D) Mice were injected i.p. with 500 ng PTx 8 h before immunization with 2.5 μg mAb-OVA together with 25 μg αCD40. Sixteen hours after immunization, DCs were isolated and tested for their capacity to activate naive OT-I T cells in vivo. Different bars indicate titration of DCs in the assay [starting at 1 × 10⁵ DCs/well (black bars) with 3-fold dilutions (gray and white bars)]. Error bars indicate SEM of triplicate wells. Data are of experiments with three mice per group. ***P < 0.01 versus control animals calculated by t test.
Fig. 4.
Fig. 4.
Both splenic Mϕ and DCs are required for functional CTL induction after adenoviral infection. (A) Three days after splenectomy, mice were infected i.v. or s.c. with 5 × 10⁹ viral particle (VP) AdLOG. Five days after infection, in vivo cytotoxicity was measured using CFSE-labeled OVA257–264-peptide-coated cells. (B) Mice were splenectomized and transplanted with isolated splenocytes, pieces of spleen, or left untreated. Seven days after surgery, mice were infected i.v. with 5 × 10⁹ VP AdLOG. In vivo cytotoxicity was determined 5 days after infection. Error bars indicate SEM, n = 3 mice in control group, n = 4 in SplX, and n = 6 in retransplanted group. ***P < 0.01 versus control, **P < 0.05 versus SplX, calculated by t test (GraphPad Prism 4). (C) Twelve hours after infection with Adgfp, spleens were analyzed for GFP expression by immunofluorescence. MMM are detected in red (SER4) and anti-GFP staining is in blue. Original magnifications: 20. (D) For Mϕ depletion, wild-type mice were injected with 200 μL clodronate liposomes and for DC depletion, CD11cDTR mice were injected with 800 ng diphtheria toxin. After 24 h and 7 days, mice were infected i.v. with 5 × 10⁹ VP AdLOG. In vivo cytotoxicity was determined 5 days after infection.
Fig. 5.
Fig. 5.
In vivo targeting to MMM results in functional antitumor CTL responses. Mice were i.v. immunized either with 5 μg αSiglec-1-OVA, 5 μg αDEC205-OVA (both together with 25 μg αCD40), or 5 × 10⁷ pfu AdOVA. After 7 days, mice were injected with B16 melanoma cells expressing OVA and luciferase in the portal vein. Tumor growth was measured on day 5 after tumor implantation by in vivo imaging (IVIS200; Xenogen). Error bars indicate SEM, n = 3–4 mice per group. ***P < 0.01 versus control. P values were calculated by one-way ANOVA with Bonferroni correction (GraphPad Prism 4 software).

Similar articles

Cited by

References

    1. Mebius RE, Kraal G. Structure and function of the spleen. Nat Rev Immunol. 2005;5:606–616. - PubMed
    1. Kraal G, Mebius R. New insights into the cell biology of the marginal zone of the spleen. Int Rev Cytol. 2006;250:175–215. - PMC - PubMed
    1. Kraal G, Janse M. Marginal metallophilic cells of the mouse spleen identified by a monoclonal antibody. Immunology. 1986;58:665–669. - PMC - PubMed
    1. Crocker PR, Gordon S. Mouse macrophage hemagglutinin (sheep erythrocyte receptor) with specificity for sialylated glycoconjugates characterized by a monoclonal antibody. J Exp Med. 1989;169:1333–1346. - PMC - PubMed
    1. Geijtenbeek TB, et al. Marginal zone macrophages express a murine homologue of DC-SIGN that captures blood-borne antigens in vivo. Blood. 2002;100:2908–2916. - PubMed

Publication types

MeSH terms