. 2009 Dec 22;106(51):21484-9.
doi: 10.1073/pnas.0906910106. Epub 2009 Dec 14.

Multiscale mobility networks and the spatial spreading of infectious diseases

Affiliations

Multiscale mobility networks and the spatial spreading of infectious diseases

Duygu Balcan et al. Proc Natl Acad Sci U S A. .

Abstract

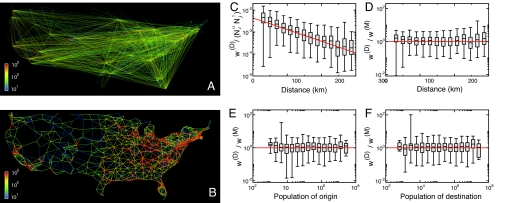
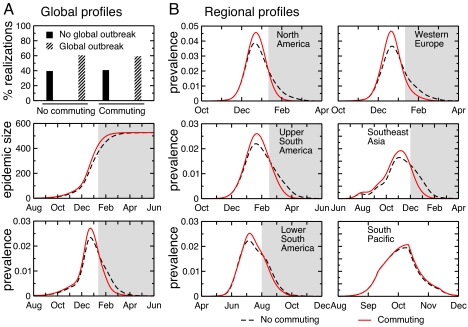
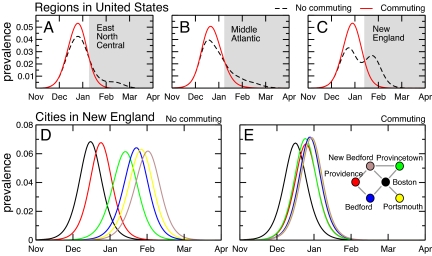
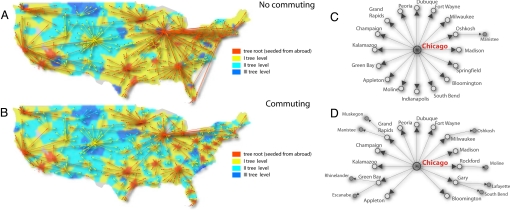
Among the realistic ingredients to be considered in the computational modeling of infectious diseases, human mobility represents a crucial challenge both on the theoretical side and in view of the limited availability of empirical data. To study the interplay between short-scale commuting flows and long-range airline traffic in shaping the spatiotemporal pattern of a global epidemic we (i) analyze mobility data from 29 countries around the world and find a gravity model able to provide a global description of commuting patterns up to 300 kms and (ii) integrate in a worldwide-structured metapopulation epidemic model a timescale-separation technique for evaluating the force of infection due to multiscale mobility processes in the disease dynamics. Commuting flows are found, on average, to be one order of magnitude larger than airline flows. However, their introduction into the worldwide model shows that the large-scale pattern of the simulated epidemic exhibits only small variations with respect to the baseline case where only airline traffic is considered. The presence of short-range mobility increases, however, the synchronization of subpopulations in close proximity and affects the epidemic behavior at the periphery of the airline transportation infrastructure. The present approach outlines the possibility for the definition of layered computational approaches where different modeling assumptions and granularities can be used consistently in a unifying multiscale framework.


Conflict of interest statement

The authors declare no conflict of interest.

Figures

Fig. 1.
Fig. 1.
Multiscale mobility networks and gravity law fit. (A) Continental U.S. airline transportation network. (B) Continental U.S. commuting network. The width and color (from blue to red) of the edges represent on a logarithmic scale the intensity of the mobility flow. (C) Commuting flux obtained from data (w(D)) rescaled by the gravity law's dependence on origin and destination populations (NiαNjγ), as a function of the distance between subpopulations. The number of people commuting between different urban areas decreases exponentially with distance up to 300 kms. (D–F) Ratio of commuting flux obtained from data (w(D)) to corresponding commuting flux predicted by the gravity model with fitted parameters (w(M)), as a function of distance, population of origin and population of destination, respectively. The three plots provide values spread ≈1, showing that the synthetic networks generated by the functional form (see Table 1) reproduce well the commuting fluxes obtained from data. Solid lines in all frames are guides to the eye.
Fig. 2.
Fig. 2.
Comparison of GLEaM predictions at the global and regional level obtained with and without commuting flows. Results refer to a pandemic influenza with R0 = 1.9 starting in Hanoi on April 1. (A, Top) Probability of outbreak. About 40% of the realizations leads to an extinction at the source (Hanoi), whereas the remaining 60% causes a pandemic reaching more than 100 countries (i.e., a global outbreak). (Middle and Bottom) Global profiles for the epidemic size (number of cases per 1,000) and the prevalence, averaged over global outbreaks. (B) Regional profiles for the prevalence averaged over all runs that led to an outbreak in the given region. All results show a very limited impact of the commuting on the simulated patterns, more evident in the faster decay in the prevalence profiles as highlighted by the shaded areas. Reported results are averaged over 103 outbreak realizations.
Fig. 3.
Fig. 3.
Comparison of GLEaM predictions at the local level obtained with and without commuting. (A–C) Prevalence profiles of three continental U.S. regions. The effect of commuting is visible in the faster decay (as highlighted by the shaded areas) and absence of multiple peaks. (D and E) Prevalence profiles for Boston area and the surrounding cities with no commuting (D) and with commuting (E). A schematic network representation of the short-range connections is shown for guidance. The synchronization among the prevalence profiles is considerably increased when commuting is considered, with a reduction of over one month in the time interval between peaks in neighboring cities. Reported profiles are averaged over 103 outbreak realizations.
Fig. 4.
Fig. 4.
Epidemic invasive tree. (A and B) Geographical representation of the continental U.S. epidemic invasion tree with only airline traffic (A) and when both airline traffic and commuting are considered (B). Red represents the roots (i.e., the first cities that were seeded from abroad), and, as we move down the tree, the colors change from yellow to dark blue. The arrows representing the edges of the tree are colored as the parent node. (C and D) We also provide a schematic representation of the invasion tree rooted at Chicago when only flights are considered (C) and with both air traffic and commuting (D). As demonstrated in both examples, the spreading pathway is completely dominated by the airline hubs as the only sources of imported seeds. However, the hierarchy is broken by the introduction of commuting flows as the number of shells around the airline hubs and the branches at the secondary nodes increase.

Similar articles

Cited by

References

    1. Riley S. Large-scale spatial-transmission models of infectious disease. Science. 2007;316:1298–1301. - PubMed
    1. Eubank S, et al. Modelling disease outbreaks in realistic urban social networks. Nature. 2004;429:180–184. - PubMed
    1. Longini IM, et al. Containing pandemic influenza at the source. Science. 2005;309:1083–1087. - PubMed
    1. Ferguson NM, et al. Strategies for containing an emerging influenza pandemic in Southeast Asia. Nature. 2005;437:209–214. - PubMed
    1. Germann TC, Kadau K, Longini IM, Macken CA. Mitigation strategies for pandemic influenza in the United States. Proc Natl Acad Sci USA. 2006;103:5935–5940. - PMC - PubMed

Publication types

MeSH terms