

A unifying model for timing of walking onset in humans and other mammals
- PMID: 20018704
- PMCID: PMC2799813
- DOI: 10.1073/pnas.0905777106
A unifying model for timing of walking onset in humans and other mammals
Erratum in
- Proc Natl Acad Sci U S A. 2011 Jan 4;108(1):433
Abstract
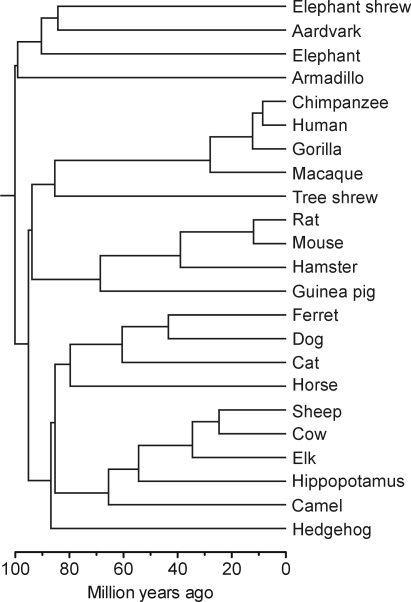
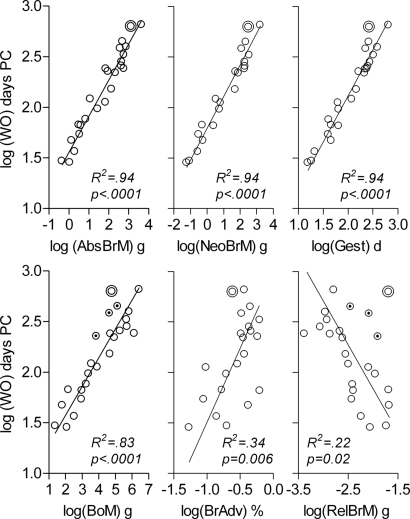
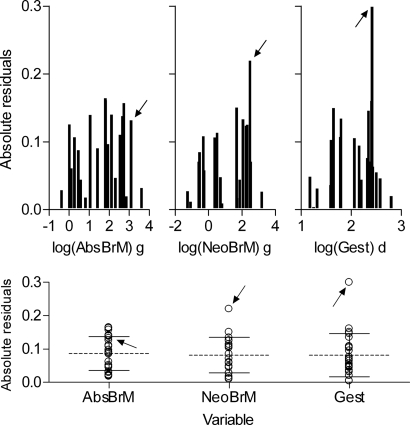
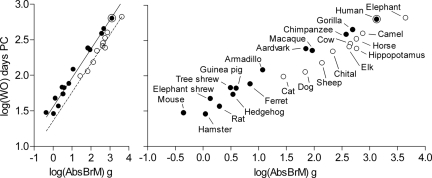
The onset of walking is a fundamental milestone in motor development of humans and other mammals, yet little is known about what factors determine its timing. Hoofed animals start walking within hours after birth, rodents and small carnivores require days or weeks, and nonhuman primates take months and humans approximately a year to achieve this locomotor skill. Here we show that a key to the explanation for these differences is that time to the onset of walking counts from conception and not from birth, indicating that mechanisms underlying motor development constitute a functional continuum from pre- to postnatal life. In a multiple-regression model encompassing 24 species representative of 11 extant orders of placental mammals that habitually walk on the ground, including humans, adult brain mass accounted for 94% of variance in time to walking onset postconception. A dichotomous variable reflecting species differences in functional limb anatomy accounted for another 3.8% of variance. The model predicted the timing of walking onset in humans with high accuracy, showing that this milestone in human motor development occurs no later than expected given the mass of the adult human brain, which in turn reflects the duration of its ontogenetic development. The timing of motor development appears to be highly conserved in mammalian evolution as the ancestors of some of the species in the sample presented here diverged in phylogenesis as long as 100 million years ago. Fundamental patterns of early human life history may therefore have evolved before the evolution of primates.
Conflict of interest statement
The authors declare no conflict of interest.
Figures
Similar articles
-
Impact of carnivory on human development and evolution revealed by a new unifying model of weaning in mammals.PLoS One. 2012;7(4):e32452. doi: 10.1371/journal.pone.0032452. Epub 2012 Apr 18. PLoS One. 2012. PMID: 22536316 Free PMC article.
-
Compliant walking in primates: elbow and knee yield in primates compared to other mammals.Am J Phys Anthropol. 2004 Sep;125(1):42-50. doi: 10.1002/ajpa.10366. Am J Phys Anthropol. 2004. PMID: 15293330
-
Brain Volume Fractions in Mammals in Relation to Behavior in Carnivores, Primates, Ungulates, and Rodents.Brain Behav Evol. 2020;95(2):102-112. doi: 10.1159/000509579. Epub 2020 Aug 28. Brain Behav Evol. 2020. PMID: 32862179
-
Cellular distribution of the calcium-binding proteins parvalbumin, calbindin, and calretinin in the neocortex of mammals: phylogenetic and developmental patterns.J Chem Neuroanat. 1999 Feb;16(2):77-116. doi: 10.1016/s0891-0618(98)00065-9. J Chem Neuroanat. 1999. PMID: 10223310 Review.
-
Comparing adult hippocampal neurogenesis in mammalian species and orders: influence of chronological age and life history stage.Eur J Neurosci. 2011 Sep;34(6):978-87. doi: 10.1111/j.1460-9568.2011.07804.x. Eur J Neurosci. 2011. PMID: 21929629 Review.
Cited by
-
Sensory feedback and central neuronal interactions in mouse locomotion.R Soc Open Sci. 2024 Aug 21;11(8):240207. doi: 10.1098/rsos.240207. eCollection 2024 Aug. R Soc Open Sci. 2024. PMID: 39169962 Free PMC article.
-
Comparing Adult Hippocampal Neurogenesis Across Species: Translating Time to Predict the Tempo in Humans.Front Neurosci. 2018 Oct 5;12:706. doi: 10.3389/fnins.2018.00706. eCollection 2018. Front Neurosci. 2018. PMID: 30344473 Free PMC article.
-
Impact of carnivory on human development and evolution revealed by a new unifying model of weaning in mammals.PLoS One. 2012;7(4):e32452. doi: 10.1371/journal.pone.0032452. Epub 2012 Apr 18. PLoS One. 2012. PMID: 22536316 Free PMC article.
-
A shift toward birthing relatively large infants early in human evolution.Proc Natl Acad Sci U S A. 2011 Jan 18;108(3):1022-7. doi: 10.1073/pnas.1003865108. Epub 2011 Jan 3. Proc Natl Acad Sci U S A. 2011. PMID: 21199942 Free PMC article.
-
Early Development of Locomotion in the Term Piglet Model: Does Size Matter?Integr Comp Biol. 2023 Sep 15;63(3):610-624. doi: 10.1093/icb/icad054. Integr Comp Biol. 2023. PMID: 37309027 Free PMC article.
References
-
- Clancy B, Darlington RB, Finlay BL. Translating developmental time across mammalian species. Neuroscience. 2001;105:7–17. - PubMed
-
- Smith BH, Tompkins RL. Toward a life history of the Hominidae. Annu Rev Anthropol. 1995;24:257–279.
-
- Hawkes K. Slow life histories and human evolution. In: Hawkes K, Paine RR, editors. The Evolution of Human Life History. Santa Fe: School of American Research Press; 2006. pp. 95–126. James Currey, Oxford.
Publication types
MeSH terms
LinkOut - more resources
Full Text Sources
