

Ecology of the rare microbial biosphere of the Arctic Ocean
- PMID: 20018741
- PMCID: PMC2796907
- DOI: 10.1073/pnas.0908284106
Ecology of the rare microbial biosphere of the Arctic Ocean
Abstract
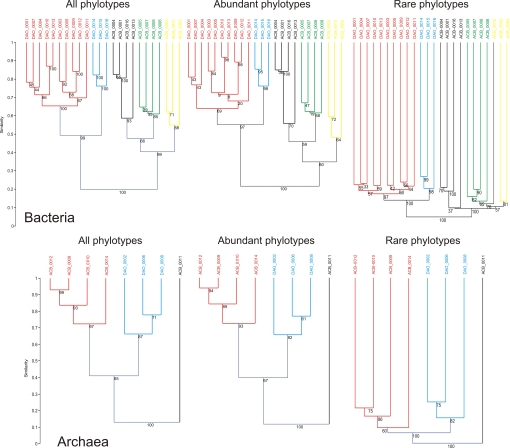
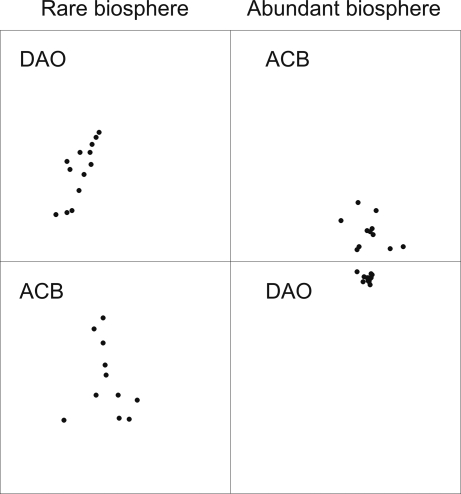
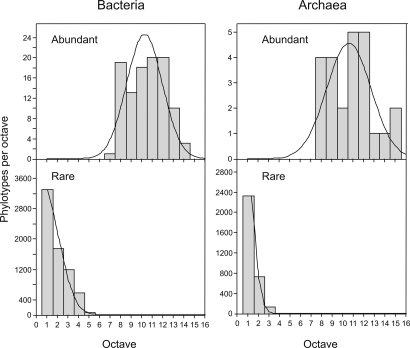
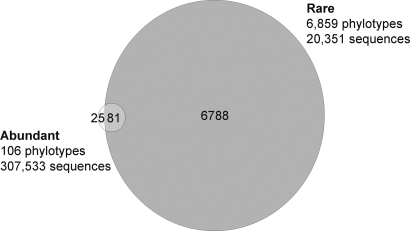
Understanding the role of microbes in the oceans has focused on taxa that occur in high abundance; yet most of the marine microbial diversity is largely determined by a long tail of low-abundance taxa. This rare biosphere may have a cosmopolitan distribution because of high dispersal and low loss rates, and possibly represents a source of phylotypes that become abundant when environmental conditions change. However, the true ecological role of rare marine microorganisms is still not known. Here, we use pyrosequencing to describe the structure and composition of the rare biosphere and to test whether it represents cosmopolitan taxa or whether, similar to abundant phylotypes, the rare community has a biogeography. Our examination of 740,353 16S rRNA gene sequences from 32 bacterial and archaeal communities from various locations of the Arctic Ocean showed that rare phylotypes did not have a cosmopolitan distribution but, rather, followed patterns similar to those of the most abundant members of the community and of the entire community. The abundance distributions of rare and abundant phylotypes were different, following a log-series and log-normal model, respectively, and the taxonomic composition of the rare biosphere was similar to the composition of the abundant phylotypes. We conclude that the rare biosphere has a biogeography and that its tremendous diversity is most likely subjected to ecological processes such as selection, speciation, and extinction.
Conflict of interest statement
The authors declare no conflict of interest.
Figures
References
-
- Azam F, Malfatti F. Microbial structuring of marine ecosystems. Nat Rev Micro. 2007;5:782–791. - PubMed
-
- Pedrós-Alió C. Marine microbial diversity: Can it be determined? Trends Microbiol. 2006;14:257–263. - PubMed
-
- Rappé MS, Giovannoni SJ. The uncultured microbial majority. Ann Rev Microbiol. 2003;57:369–394. - PubMed
-
- Pace NR. A molecular view of microbial diversity and the biosphere. Science. 1997;276:734–740. - PubMed
Publication types
MeSH terms
Substances
LinkOut - more resources
Full Text Sources
Other Literature Sources
