

Nanoscale cues regulate the structure and function of macroscopic cardiac tissue constructs
- PMID: 20018748
- PMCID: PMC2818944
- DOI: 10.1073/pnas.0906504107
Nanoscale cues regulate the structure and function of macroscopic cardiac tissue constructs
Abstract
Heart tissue possesses complex structural organization on multiple scales, from macro- to nano-, but nanoscale control of cardiac function has not been extensively analyzed. Inspired by ultrastructural analysis of the native tissue, we constructed a scalable, nanotopographically controlled model of myocardium mimicking the in vivo ventricular organization. Guided by nanoscale mechanical cues provided by the underlying hydrogel, the tissue constructs displayed anisotropic action potential propagation and contractility characteristic of the native tissue. Surprisingly, cell geometry, action potential conduction velocity, and the expression of a cell-cell coupling protein were exquisitely sensitive to differences in the substratum nanoscale features of the surrounding extracellular matrix. We propose that controlling cell-material interactions on the nanoscale can stipulate structure and function on the tissue level and yield novel insights into in vivo tissue physiology, while providing materials for tissue repair.
Conflict of interest statement
The authors declare no conflict of interest.
Figures
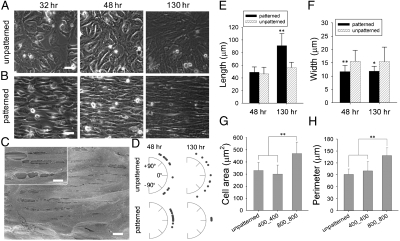
 unless otherwise specified). (C) SEM image of NRVMs cultured on the ANFS showing anisotropic nanopatterns, aligned cardiomyocytes, and intercellular junctional structures. The Inset in (C) shows the transverse interconnectivity of the cells. (D) Quantification of cell orientation on the ANFS vs. unpatterned substrata. Each dot represents a single cell, and an orientation of 0° represents perfect alignment with the ridge/groove direction. Quantification of the (E) myocyte length and (F) width on the ANFS vs. the unpatterned substratum. Quantitative comparison of the (G) cell projected area and (H) perimeter between two different ridge/groove ratios (
 vs.
vs.  , n = 33 for each group). Error bars in (E–H) represent the SD about the means. ∗p < 0.005; ∗∗p < 0.0005. [Scale bar: 5 μm in (A–C).]
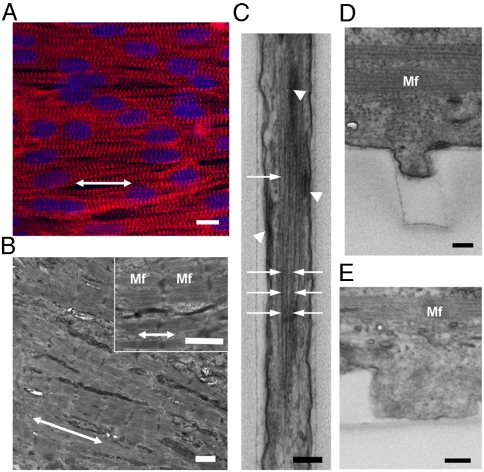
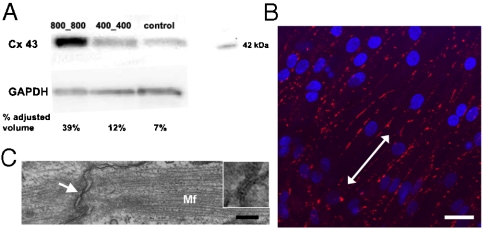
 widths. (B) Immunofluorescent images of the stained Cx43 of NRVMs on the ANFS. (C) TEM image of GJs aligned with the nanopatterns. The Inset in (C) denotes the GJs at the longitudinal end of two adjacent cells indicated by white arrow. [Scale bar: 20 μm in (B); 200 nm in (C).]
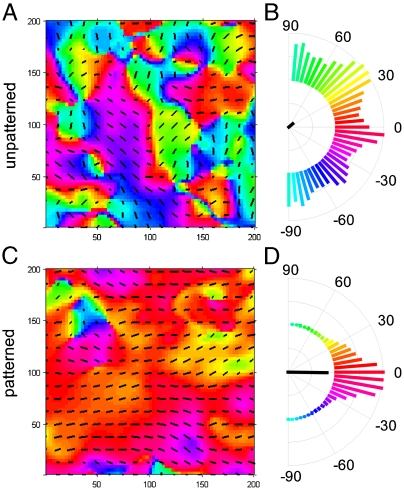
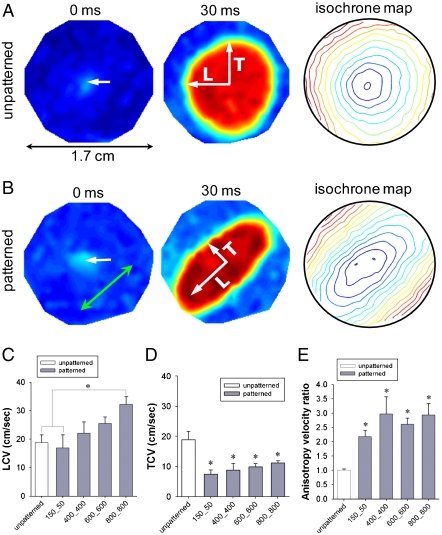
 width showed a trend toward increasing the (C) LCV and (D) TCV (n = 6 for the unpatterned group, n = 4 for each patterned group, ∗p < 0.05 compared with the unpatterned group). In addition, for NRVM monolayers on the ANFS, the LCV was significantly faster than the TCV (n = 4 per group, ∗p < 0.05 between the LCV and TCV for
  and above). In contrast, NRVM monolayers on unpatterned substrata showed no directional differences in the CV (LCV = 19 ± 7 cm/ sec, TCV = 19 ± 7 cm/ sec, n = 6). (E) The ratio of longitudinal to transverse conduction velocity (LCV/TCV) was more than doubled for NRVM monolayers seeded onto patterned substrata (ridge-to-groove ratios ranging from
  to
to  ), as compared with the ratio for unpatterned control substrata (n = 4 for patterned groups and n = 6 for the unpatterned control group, ∗p < 0.05 compared with the unpatterned group). Error bars in (C–E) represent the SEM.
References
-
- Stevens M, George J. Exploring and engineering the cell surface interface. Science. 2005;310:1135–1138. - PubMed
-
- Mannix RJ, et al. Nanomagnetic actuation of receptor-mediated signal transduction. Nat Nanotechnol. 2008;3:36–40. - PubMed
-
- Koo LY, Irvine DJ, Mayes AM, Lauffenburger DA, Griffith LG. Co-regulation of cell adhesion by nanoscale RGD organization and mechanical stimulus. J Cell Sci. 2002;115:1423–1433. - PubMed
Publication types
MeSH terms
Substances
Grants and funding
LinkOut - more resources
Full Text Sources
Other Literature Sources
