

Food webs are more than the sum of their tritrophic parts
- PMID: 20018774
- PMCID: PMC2799696
- DOI: 10.1073/pnas.0910582106
Food webs are more than the sum of their tritrophic parts
Abstract
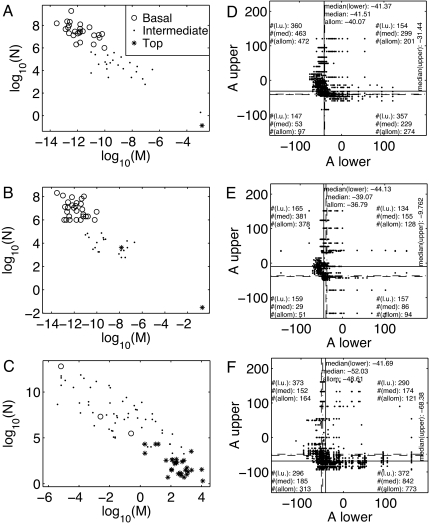
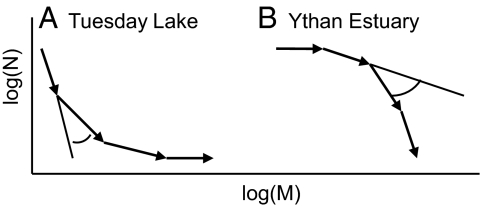
Many studies have aimed to understand food webs by investigating components such as trophic links (one consumer taxon eats one resource taxon), tritrophic interactions (one consumer eats an intermediate taxon, which eats a resource), or longer chains of links. We show here that none of these components (links, tritrophic interactions, and longer chains), individually or as an ensemble, accounts fully for the properties of the next higher level of organization. As a cell is more than its molecules, as an organ is more than its cells, and as an organism is more than its organs, in a food web, new structure emerges at every organizational level up to and including the whole web. We demonstrate the emergence of properties at progressively higher levels of structure by using all of the directly observed, appropriately organized, publicly available food web datasets with relatively complete trophic link data and with average body mass and population density data for each taxon. There are only three such webs, those of Tuesday Lake, Michigan, in 1984 and 1986, and Ythan Estuary, Scotland. We make the data freely available online with this report. Differences in web patterns between Tuesday Lake and Ythan Estuary, and similarities of Tuesday Lake in 1984 and 1986 despite 50% turnover of species, suggest that the patterns we describe respond to major differences between ecosystem types.
Conflict of interest statement
The authors declare no conflict of interest.
Figures


Similar articles
-
Robust patterns in food web structure.Phys Rev Lett. 2002 Jun 3;88(22):228102. doi: 10.1103/PhysRevLett.88.228102. Epub 2002 May 16. Phys Rev Lett. 2002. PMID: 12059454
-
Phylogeny versus body size as determinants of food web structure.Proc Biol Sci. 2012 Aug 22;279(1741):3291-7. doi: 10.1098/rspb.2012.0327. Epub 2012 May 23. Proc Biol Sci. 2012. PMID: 22628467 Free PMC article.
-
Top predators govern multitrophic diversity effects in tritrophic food webs.Ecology. 2021 Jul;102(7):e03379. doi: 10.1002/ecy.3379. Epub 2021 Jun 16. Ecology. 2021. PMID: 33937982
-
Food webs and the transmission of parasites to marine fish.Parasitology. 2002;124 Suppl:S83-99. doi: 10.1017/s003118200200149x. Parasitology. 2002. PMID: 12396218 Review.
-
The more food webs change, the more they stay the same.Philos Trans R Soc Lond B Biol Sci. 2009 Jun 27;364(1524):1789-801. doi: 10.1098/rstb.2008.0273. Philos Trans R Soc Lond B Biol Sci. 2009. PMID: 19451128 Free PMC article. Review.
Cited by
-
Exploring context dependency in eco-evolutionary patterns with the stick insect Timema cristinae.Ecol Evol. 2020 Jul 15;10(15):8197-8209. doi: 10.1002/ece3.6526. eCollection 2020 Aug. Ecol Evol. 2020. PMID: 32788972 Free PMC article.
-
Community and ecosystem responses to recent climate change.Philos Trans R Soc Lond B Biol Sci. 2010 Jul 12;365(1549):2019-24. doi: 10.1098/rstb.2010.0021. Philos Trans R Soc Lond B Biol Sci. 2010. PMID: 20513710 Free PMC article. Review.
-
Food web structure in a harsh glacier-fed river.PLoS One. 2013 Apr 15;8(4):e60899. doi: 10.1371/journal.pone.0060899. Print 2013. PLoS One. 2013. PMID: 23613751 Free PMC article.
-
World Wide Food Webs: power to feed ecologists.Ambio. 2011 May;40(3):335-7. doi: 10.1007/s13280-010-0069-5. Ambio. 2011. PMID: 21644463 Free PMC article. No abstract available.
-
Stability lies in flowers: Plant diversification mediating shifts in arthropod food webs.PLoS One. 2018 Feb 16;13(2):e0193045. doi: 10.1371/journal.pone.0193045. eCollection 2018. PLoS One. 2018. PMID: 29451903 Free PMC article.
References
-
- Hairston NG, Smith FE, Slobodkin LB. Community structure, population control, and competition. Am Nat. 1960;94:421–425.
-
- Fretwell SD. Food chain dynamics: The central theory of ecology? Oikos. 1987;50:291–301.
-
- Carpenter SR, Kitchell JF, editors. The Trophic Cascade in Lakes. Cambridge, UK: Cambridge Univ Press; 1993.
-
- Polis GA. Why are parts of the world green? Multiple factors control productivity and the distribution of biomass. Oikos. 1999;86:3–15.
-
- Polis GA, Sears ALW, Huxel GR, Strong DR, Maron J. When is a trophic cascade a trophic cascade? Trends in Ecology and Evolution. 2000;15:473–475. - PubMed
Publication types
MeSH terms
LinkOut - more resources
Full Text Sources
Research Materials
