. 2010 Feb;103(2):887-903.
doi: 10.1152/jn.00813.2009. Epub 2009 Dec 16.

Spectral and temporal modulation tradeoff in the inferior colliculus

Affiliations

Spectral and temporal modulation tradeoff in the inferior colliculus

Francisco A Rodríguez et al. J Neurophysiol. 2010 Feb.

Abstract

The cochlea encodes sounds through frequency-selective channels that exhibit low-pass modulation sensitivity. Unlike the cochlea, neurons in the auditory midbrain are tuned for spectral and temporal modulations found in natural sounds, yet the role of this transformation is not known. We report a distinct tradeoff in modulation sensitivity and tuning that is topographically ordered within the central nucleus of the inferior colliculus (CNIC). Spectrotemporal receptive fields (STRFs) were obtained with 16-channel electrodes inserted orthogonal to the isofrequency lamina. Surprisingly, temporal and spectral characteristics exhibited an opposing relationship along the tonotopic axis. For low best frequencies (BFs), units were selective for fast temporal and broad spectral modulations. A systematic progression was observed toward slower temporal and finer spectral modulation sensitivity at high BF. This tradeoff was strongly reflected in the arrangement of excitation and inhibition and, consequently, in the modulation tuning characteristics. Comparisons with auditory nerve fibers show that these trends oppose the pattern imposed by the peripheral filters. These results suggest that spectrotemporal preferences are reordered within the tonotopic axis of the CNIC. This topographic organization has profound implications for the coding of spectrotemporal features in natural sounds and could underlie a number of perceptual phenomena.


Figures

Fig. 1.
Fig. 1.
Mapping spectrotemporal receptive field preferences within the central nucleus of the inferior colliculus (CNIC). A: illustration showing the placement of sixteen-channel recording probes into the CNIC. Probes were inserted at 30° relative to the sagittal plane and approximately orthogonal to the CNIC isofrequency lamina (---). The dorsal cortex (DC, red) and lateral cortex (LC, blue) of the IC are shown for reference. B: surface view of the IC from 1 experiment with the probe penetration sites superimposed. Penetration sites were selected to provide a uniform coverage of the IC in a grid-like pattern with ∼300 μm along the anterior-posterior and mediolateral aspect. Sites that did not exhibit a definitive best frequency gradient are marked (×). These recording locations were presumed to be outside the central nucleus of the IC and were discarded from the analysis. C–F: example STRFs from penetrations within the IC of 4 separate experiments. Penetrations for E and F are from the experiment in B (sites 8 and 48, respectively). Recording sites within the CNIC exhibit a distinct tonotopic gradient with increasing penetration depth (C–E). Site F lacks this tonotopic organization. This site was presumed to lie outside the CNIC and was discarded from the analysis.
Fig. 2.
Fig. 2.
Quantitative analysis of spectrotemporal and modulation tuning preferences. A and C: spectrotemporal receptive fields (STRFs) and the corresponding ripple transfer function (RTF, B and D) of 2 units. A unit with short STRF integration time that lacks sideband inhibition is shown in A. Temporally, this unit exhibits a fast off-on-off pattern suggesting selectivity to fast temporal modulations. In contrast, the unit of C has longer integration time, narrower bandwidth, and significant spectral sideband and temporal inhibition. Only the significant portion of the STRF is shown (P < 0.002, see methods). The spectral and temporal marginals are obtained for each STRF by projecting the STRF along the spectral and temporal dimensions (blue lines, see methods). The receptive field bandwidth and integration time are defined as twice the SD of the spectral and temporal marginals, respectively. B and D: ripple transfer functions for the units of A and C are obtained by Fourier transforming the STRF (Escabí and Schreiner 2002). The latency axis of the STRF is now represented by the temporal modulation frequency (Hz), whereas the spectral axis is represented by the spectral modulation frequency (cycle/octave). The unit of B, same as A, is characterized by a band-pass tuned temporal response at ∼265 Hz (bTMF) and low-pass spectral response with peak at 0.1 cycle/octave (bSMF; noted by black dot). The high bTMF and low bSMF for this unit are consistent with the broad but fast off-on-off pattern observed in its STRF. The 3-dB spectral and temporal upper cutoffs (tMTF and sMTF upper cutoff, shown by asterisk) for this unit lie at 0.7 cycle/octave and 408 Hz (defined as the maximum frequencies for which RTF power exceeds 0.5 of the peak response power), consistent with the observed broad spectral bandwidth and fast temporal response for this unit. D: the RTF for the unit of C is characterized by a weakly tuned pattern about a bSMF of 1.6 cycle/octave, bTMF of 70.3 Hz, and 3-dB spectral and temporal upper cutoffs of 3.4 cycle/octave and 112.3 Hz. This is consistent with the slow temporal pattern, narrow bandwidth, and pronounced sideband inhibition as observed for this unit's STRF (C).
Fig. 3.
Fig. 3.
Spectrotemporal tradeoff in modulation selection. Best temporal and spectral modulation frequencies covary. Sites with fast temporal preferences (high bTMF) have coarse spectral resolution (low bSMF), whereas sites with high spectral resolution (high bSMF) prefer slow temporal modulations (low bTMF). B—I: STRFs (A–H, left) and RTFs (B–I, right) from examples sites are selected to cover the CNIC response space (red dots in A). B—D: recording sites that exhibit narrow spectral tuning and strong sideband inhibition are characterized by high bSMF. These same units are tuned to slow temporal modulations. E and F: recording sites with narrow bandwidths and lack of sideband inhibition are tuned for low bSMF. These 2 units have long integration times and respond optimally to low bTMF. G: a fast neuron that lacks sideband inhibition but has a fast on-off STRF pattern. H and I: units with broadband spectral selectivity that lack sideband inhibition are tuned to low spectral modulations. Both of these units exhibit fast temporal integration with interleaving patterns of excitation and inhibition and are tuned for fast temporal modulations.
Fig. 4.
Fig. 4.
Population spectrotemporal tuning varies systematically with best frequencies. Ripple transfer functions were obtained for each unit and averaged for different best frequency (BF) ranges. BFs were first partitioned into ½-octave bands and the population RTF was obtained for each ½-octave range (frequency range is noted above each panel). Best temporal and spectral modulation frequencies are shown for each unit as dots on each panel (•, multiunits; formula image, single units). Low-frequency units were concentrated about low spectral resolution (low bSMF) and fast temporal modulations (high bTMF). Accordingly, the population RTFs for low frequencies consisted of a dominant response lobe that extended to high bTMF values and had little energy for bSMF >0.5 cycle/octave (e.g., A and B). In contrast high-frequency sites (e.g., F–H) prefer finer spectral (high bSMF) and slower temporal modulations (low bTMF). This was evident both in the density of units as well as the energy distribution for the population RTF for each frequency band. A smooth continuum was observed such that spectrotemporal preferences varied systematically with increasing BF.
Fig. 5.
Fig. 5.
Spectrotemporal resolution and modulation tuning characteristics vary systematically with recording location BF. Quantitative analysis of the STRF preferences reveals that temporal and spectral modulation selectivity exhibit opposing trends with increasing BF.formula image , median values for single units; ■, multi units. A and C: median best temporal modulation and upper cutoffs decrease, while median best spectral modulation and upper cutoffs increase with increasing BF (B and D). A related trend is also observed for the STRF integration time and proportional bandwidth (in octaves). Median integration times (E) and proportional bandwidths (F) exhibit an opposing trend with increasing BF. Temporal integration times are shorter and spectral bandwidths (in octaves) are broader for low-frequency sites (2–4 kHz). G: in contrast, absolute bandwidths (Hz) increase with increasing BF. *, designate significant comparisons (Wilcoxon rank sum, P < 0.05).
Fig. 6.
Fig. 6.
Cochlear filter bandwidths and the uncertainty principle do not account for the observed spectrotemporal resolution tradeoff. A: the time-frequency resolution (Δt vs. Δf) of AN fibers (red: data from Joris and Yin 1992; blue: data from Kim and Young 1994; dots: AN fibers with 2 < BF < 32 kHz; plus sign: AN Fibers with BF outside this range) roughly follow the inverse relationship for the uncertainty principle: Δt·Δf ≥ 1/π (dotted line). By comparison, the time-frequency resolution (Δt vs. Δf) of CNIC units deviates substantially from this theoretical bound (a; black dots = multiunits; gray dots = single units). Units with Δt >15 ms are not shown (n = 5). B: the same data as in A are shown using a double-logarithmic axis. Note that the time and frequency resolution of AN fibers is strongly negatively correlated and is within an order of magnitude of the uncertainty principle. C–F: the distribution of time-frequency resolution products, Δt·Δf, from all CNIC recording sites (gray stacked histogram corresponds to single units; black stacked histogram corresponds to multiunits) and AN fibers (red histogram = Joris and Yin 1992; blue histogram = Kim and Young 1994) is shown as a function of best frequency (2–4, 4–8, 8–16, 16–32 kHz). For reference, the theoretical lower bound of 1/π imposed by the uncertainty principle is noted by dashed lines. For the vast majority of CNIC units, the time-frequency resolution product is greater than for AN fibers and more than an order of magnitude from the theoretical limit. Furthermore, the time-frequency resolution increases systematically with increasing BF.
Fig. 7.
Fig. 7.
The role of excitation and inhibition in modulation tuning. A: increasing the amount of temporal inhibition in a model STRF (A, left to right) changes the temporal tuning in the RTF from low- to band-pass (B, left to right). The strength of inhibition in the STRF was quantified by the inhibitory-to-excitatory power ratio (IER) while the strength of modulation tuning is characterized by the DC gain (see methods). C: temporal DC gains from B decrease with increasing IER indicating that stronger temporal inhibition leads to stronger temporal tuning. D, left to right: increasing the amount of sideband inhibition in a model STRF leads to more pronounced spectral tuning (E, left to right). F: spectral DC gains from the corresponding RTFs (E) decrease with increasing IER, indicating that stronger sideband inhibition leads to stronger spectral modulation tuning.
Fig. 8.
Fig. 8.
Strength of modulation tuning covaries with the strength of STRF inhibition. A–C: quantitative analysis of excitatory and inhibitory STRF components. Each STRF was broken up into an inhibitory and excitatory component. The unit of A exhibits a strictly excitatory STRF. The corresponding RTF for this unit (far right) is low-pass for both spectral and temporal modulations. B: this unit exhibits a strong temporal excitatory and inhibitory pattern. Accordingly its RTF (far right) is strongly tuned for temporal modulations. The unit of C exhibits strong sideband inhibition and a weak temporal inhibitory component. This is reflected in its RTF as weak temporal tuning and strong spectral tuning (far right). D–F: histograms showing that the strength of STRF inhibition covaries with the amount of modulation tuning across all CNIC units. The IER is negatively correlated with the temporal DC gains (D), spectral DC gains (E), and the maximum of the temporal or spectral DC gains (F). The units of AC are represented by ×, +, and *, respectively.
Fig. 9.
Fig. 9.
Excitatory and inhibitory STRF preferences vary with BF. The population averaged excitatory (top) and inhibitory (bottom) STRF is shown for four frequency ranges (2–4, 4–8, 8–16, 16–32 kHz). At low frequencies (2–4 kHz), the excitatory STRF exhibits substantially broader bandwidths compared with high-frequency sites (16–32 kHz). In contrast, the structure of the inhibitory STRF is much more complex. For low frequencies (2–4 kHz), the STRFi is dominated by a brief (∼2 ms) but strong temporal inhibitory component that spans ∼1.8 octave. For this range of frequencies (2–4 kHz), sideband inhibition is not present. For high BFs (16–32 kHz), sideband inhibition becomes stronger and the STRF temporal inhibition is substantially narrower and longer.
Fig. 10.
Fig. 10.
Excitatory and inhibitory STRF preferences vary with recording location BF. Quantitative analysis of the excitatory and inhibitory STRF demonstrates that temporal and spectral preferences shift in opposing directions with increasing BF. formula image , median values to single units; ▪, multiunits. The excitatory (A) and inhibitory (D) integration time both increase with BF while STRF excitatory bandwidths (in octaves) decrease (B). In contrast, absolute excitatory bandwidths increase with BF (C). The corresponding bandwidth trends for the inhibitory STRF component (E and F) were less systematic and differed somewhat between single and multiunits. *, significant comparisons (Wilcoxon rank sum, P < 0.05).
Fig. 11.
Fig. 11.
Strength of modulation tuning varies with BF. The proportion of single and multiunits that exhibit temporal (A) or spectral (B) band-pass modulation tuning (3-dB criterion, see methods) increases with BF (t-test, P < 0.05). formula image
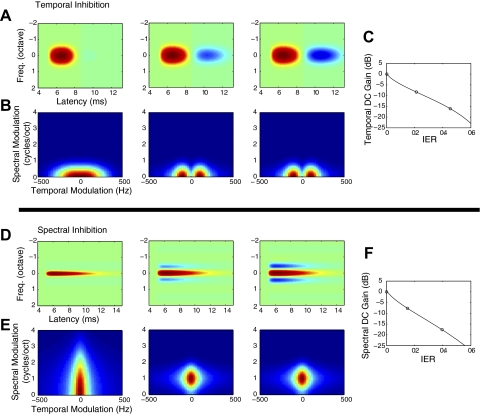
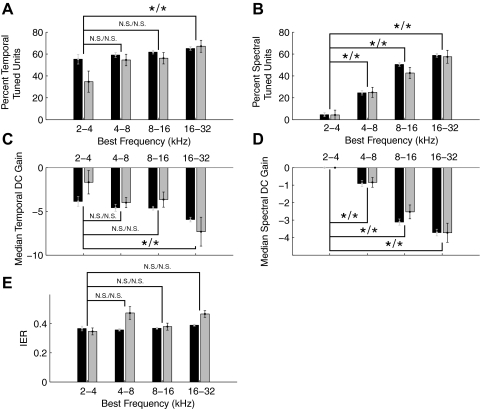
, single units; ▪, multiunits. Median temporal (C) and spectral (D) DC gains decrease with BF (Wilcoxon rank sum, P < 0.05) consistent with stronger temporal and spectral band-pass modulation tuning for higher frequency sites. The inhibitory-to-excitatory power ratio (IER) does not exhibit a significant increase for higher frequency sites (Wilcoxon rank sum, N.S.). *, significant comparisons (P < 0.05).

Similar articles

Cited by

References

    1. Adams JC. Ascending projections to the inferior colliculus. J Comp Neurol 183: 519–538, 1979 - PubMed
    1. Andoni S, Li N, Pollak GD. Spectrotemporal receptive fields in the inferior colliculus revealing selectivity for spectral motion in conspecific vocalizations. J Neurosci 27: 4882–4893, 2007 - PMC - PubMed
    1. Attias H, Schreiner C. Low-order temporal statistics of natural sounds. Adv Neural Inform Process Syst 9: 27–33, 1998a
    1. Attias H, Schreiner C. Coding of naturalistic stimuli by auditory midbrain neurons. Adv Neural Inform Process Syst 10: 103–109, 1998b
    1. Batra R, Fitzpatrick DC. Discharge patterns of neurons in the ventral nucleus of the lateral lemniscus of the unanesthetized rabbit. J Neurophysiol 82: 1097–1113, 1999 - PubMed

Publication types

LinkOut - more resources