. 2010 Feb 12;285(7):5026-39.
doi: 10.1074/jbc.M109.032672. Epub 2009 Dec 14.

Growth factor regulation of prostaglandin-endoperoxide synthase 2 (Ptgs2) expression in colonic mesenchymal stem cells

Affiliations

Growth factor regulation of prostaglandin-endoperoxide synthase 2 (Ptgs2) expression in colonic mesenchymal stem cells

Monica R Walker et al. J Biol Chem. .

Abstract

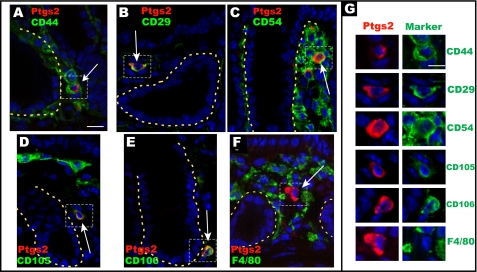
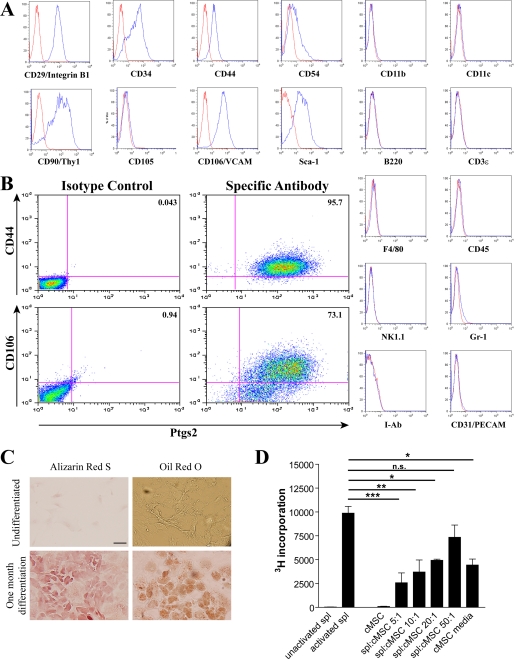
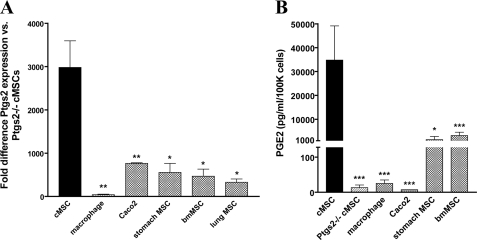
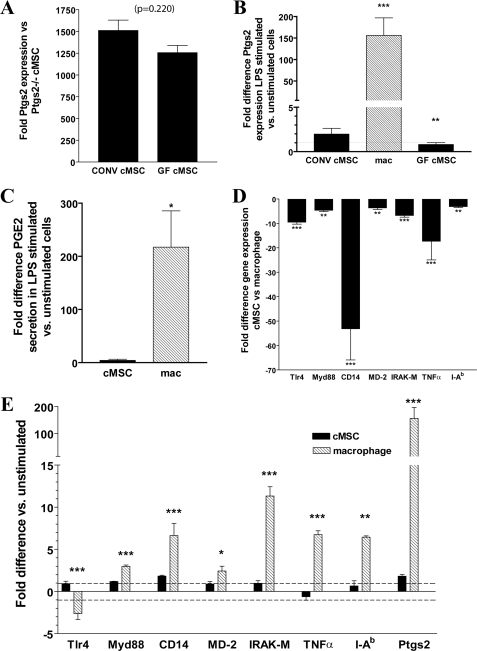
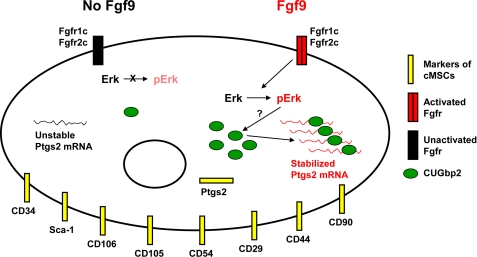
We previously found that a population of colonic stromal cells that constitutively express high levels of prostaglandin-endoperoxide synthase 2 (Ptgs2, also known as Cox-2) altered their location in the lamina propria in response to injury in a Myd88-dependent manner (Brown, S. L., Riehl, T. E., Walker, M. R., Geske, M. J., Doherty, J. M., Stenson, W. F., and Stappenbeck, T. S. (2007) J. Clin. Invest. 117, 258-269). At the time of this study, the identity of these cells and the mechanism by which they expressed high levels of Ptgs2 were unknown. Here we found that these colonic stromal cells were mesenchymal stem cells (MSCs). These colonic MSCs expressed high Ptgs2 levels not through interaction with bacterial products but instead as a consequence of mRNA stabilization downstream of Fgf9 (fibroblast growth factor 9), a growth factor that is constitutively expressed by the intestinal epithelium. This stabilization was mediated partially through a mechanism involving endogenous CUG-binding protein 2 (CUGbp2). These studies suggest that Fgf9 is an important factor in the regulation of Ptgs2 in colonic MSCs and may be a factor involved in its constitutive expression in vivo.


Figures

FIGURE 1.
FIGURE 1.
Ptgs2-expressing stromal cells co-localize with markers of mesenchymal stem cells in vivo. Sections of the rectum from WT C57Bl/6 mice co-stained with Alexa-Fluor 594 Zenon-labeled anti-mouse Ptgs2 IgG1 (red) and various MSC and hematopoietic markers. All MSC markers (A–E) were visualized with an Alexa-Fluor 488-conjugated anti-rat Ig secondary antibody used to detect rat anti-mouse CD44 (A), rat anti-mouse CD29 (B), rat anti-mouse CD54 (C), rat anti-mouse CD105 (D), and rat anti-mouse CD106 (E). The hematopoietic co-staining marker was fluorescein isothiocyanate-conjugated F4/80 (F). The yellow dashed lines denote the basolateral membrane of the epithelium. G, magnified insets of the dashed boxed portions of A–F. Ptgs2 co-labels with all MSC markers but not F4/80. Bars, 20 μm (A–F) and 15 μm (G).
FIGURE 2.
FIGURE 2.
Isolated colonic stromal cells are mesenchymal stem cells and maintain Ptgs2 expression. A, representative histograms of flow cytometric analysis of cultured colonic stromal cells (n = 5 lines) at passages 3–5 stained for the markers shown (blue lines). Antibodies to CD11b, CD11c, CD90, Sca-1, B220, CD3ϵ, F4/80, CD45, NK1.1, Gr-1, and I-Ab were preconjugated fluorescein isothiocyanate- or Alexa-Fluor 488-labeled primary mouse antibodies. Cells labeled with CD29, CD34, CD44, CD54, CD105, CD106, and CD31 were detected with an Alexa-Fluor 488-conjugated anti-rat secondary. Controls were antibodies of the same isotype (red lines). B, representative double label flow cytometric analysis of colonic stromal cells (n = 3 lines) co-stained with either CD44 or CD106 as described above and Ptgs2 detected by Alexa-Fluor 647-conjugated anti-mouse antibody. C, representative histological images of colonic stromal cells (n = 3 lines), which were plated on coverslips and treated for 21 days in appropriate media conditions (see “Experimental Procedures”). Following incubation, cells were fixed and stained for calcium deposition by Alizarin Red S or for lipid deposition by Oil Red O. Undifferentiated cells plated 2 days before staining were likewise visualized. Bar, 50 μm. D, graph of [3H]thymidine incorporation by splenocytes (spl). Splenocytes were plated with or without activation by antibodies to CD3ϵ and CD28 in triplicate in 96-well plates. Colonic stromal cells were similarly plated either alone or at varying ratios with splenocytes. Error bars, S.D. Statistical analysis by analysis of variance and Bonferroni post-test is shown: *, p < 0.05; **, p < 0.01; ***, p < 0.001; n.s., not significant.
FIGURE 3.
FIGURE 3.
High constitutive Ptgs2 expression is unique to cMSCs. A, graph comparing Ptgs2 expression by qRT-PCR in various cell lines (base line: cMSCs isolated from Ptgs2/ mice). MSC lines were isolated from the colon (n = 7 lines), stomach (n = 4 lines), bone marrow (n = 4 lines), and lung (n = 2 lines) of WT C57Bl/6 mice and colon of Ptgs2/ mice (n = 2 lines). Macrophages (n = 2 lines) were derived from bone marrow of C57Bl/6 mice with differentiation in L-cell supernatant. Caco2 cell data represent n = 2 different passages. All cDNAs used in qRT-PCR were synthesized using random hexamer primers. Statistical markings (asterisks) refer to comparison with WT cMSC Ptgs2 expression. B, graph of PGE2 secretion measured by an enzyme-linked immunosorbent assay of various cell lines described above. Statistical markings refer to comparison with WT cMSC PGE2 secretion. Error bars, S.D. Statistical analysis by Student's t test is shown: *, p < 0.05; **, p < 0.01; ***, p < 0.001; n.s., not significant.
FIGURE 4.
FIGURE 4.
High constitutive expression of Ptgs2 is not due to TLR activation. Colonic MSCs from CONV and GF mice and bone marrow-derived macrophages were isolated and analyzed. A, graph of Ptgs2 expression difference in cMSCs isolated from CONV (n = 3 lines) and GF mice (n = 2 lines) measured by qRT-PCR (base line: cMSCs from CONV Ptgs2−/− mice). p = 0.220, Student's t test. B, graph of Ptgs2 expression difference in MSCs and macrophages plated and stimulated by LPS (1–100 ng/ml) for 21 h (base line: unstimulated cells). C, graph of PGE2 secretion -fold difference (base line: secretion from unstimulated cells) from cells stimulated by LPS measured by an enzyme-linked immunosorbent assay of supernatants from cMSC (n = 3 lines) and macrophages (n = 3). D, graph of TLR4 pathway member gene expression -fold difference in cMSCs (n = 3 lines) base-lined to macrophages (n = 3 lines) for each gene measured by qRT-PCR. E, graph of -fold expression difference in members of the TLR4 pathway and target genes measured by qRT-PCR in 21-h LPS-stimulated cells (base line: unstimulated cells). Statistical markings represent significance in the -fold difference of a given gene in cMSCs compared with the -fold difference of that gene in macrophages. Error bars, S.D. Statistical analysis by analysis of variance and Bonferroni post-test (B) or Student's t test (A and E) is shown: *, p < 0.05; **, p < 0.01; ***, p < 0.001. TNFα, tumor necrosis factor-α.
FIGURE 5.
FIGURE 5.
Comparison of cMSCs with bmMSCs reveals possible mechanistic pathways involved in Ptgs2 expression. A, Venn diagram illustrating the intersection of the GO terms “integral to plasma membrane” and “receptor activity” obtained through GO analysis of genes preferentially expressed in cMSCs (compared with bmMSCs). Data for analysis were obtained by isolation of total RNA from cMSCs (n = 2 lines) and bmMSCs (n = 2 lines), amplification and cRNA labeling, hybridization to Affymetrix MOE430A microarrays, and dCHIP analysis of genes preferentially expressed in one cell type or the other at a 1.3-fold level, p < 0.05. B, heat map generated by dCHIP software of genes fitting into the logical intersection of “integral to plasma membrane” and “receptor activity” showing relative expression levels in each cell line. C, electrophoresis gel of PCR amplifying cDNA obtained from whole WT C57Bl/6 mouse intestine for the FGF receptor splice forms: Fgfr1b, Fgfr1c, Fgfr2b, Fgfr2c, and Fgfr4 (annealing temperature = 60 °C) and Fgfr3b and Fgfr3c (annealing temperature = 65 °C). D, graph of qRT-PCR measurements of the various splice forms of the FGF receptors expressed in cMSCs (n = 3 lines) compared with water control. Error bars, S.D.
FIGURE 6.
FIGURE 6.
Fgf9 is sufficient to stabilize Ptgs2 mRNA. qRT-PCR analysis (A–C and E–G) of cMSCs is shown. A, graph of the -fold difference for Ptgs2 and Ptgs1 expression of serum-starved cMSCs versus cMSCs grown in 10% serum. B, graph of the -fold difference for Ptgs2 and Ptgs1 expression in cMSCs after 1 h of Fgf9 treatment (range = 1–500 ng/ml) following 3 h of serum starvation. C, graph of the -fold difference for Ptgs2 expression after treatment with Fgf9 or Fgf9 plus anti-Fgf9 neutralizing antibody following 3 h of serum starvation. D, schematic illustrating the location of primers 1, 2, and 3 on the Ptgs2 gene. E, graph of the -fold difference for the spliced and unspliced forms of Ptgs2 isolated from 3-h serum-starved cMSCs additionally treated for 1 h with Fgf9. F, graph showing the -fold difference for Ptgs2 spliced RNA after treatment with or without serum starvation, 4 μg/ml actinomycin D, and 250 ng/ml Fgf9. The asterisks show comparison of data with -fold difference in cells treated with 0% serum and actinomycin D. G, graph showing the -fold difference for Ptgs2 unspliced RNA with or without serum starvation, 4 μg/ml actinomycin D, and 250 ng/ml Fgf9 (UD, undetectable). All data are representative of three independent experiments. Error bars, S.D. Statistical analysis by Student's t test is shown: *, p < 0.05; **, p < 0.01; ***, p < 0.001; n.s., not significant.
FIGURE 7.
FIGURE 7.
Fgf9 stabilizes Ptgs2 partially through ERK activation and increased CUGbp2 protein. A, graph of the -fold difference for Ptgs2 and CUGbp2 mRNA following a 3-h treatment of cMSCs with an ERK kinase inhibitor, PD98059 (100 or 300 μm), or 0% serum. B, reducing immunoblot of PD98059-treated cMSCs probed for actin (loading control), phosphorylated ERK, and CUGbp2. C, graph of the quantification of B showing the ratio of CUGbp2/actin protein quantity in cMSCs treated by serum starvation or with PD98059. Base line (1.00) was the ratio of cMSCs grown in 10% serum. D, graph of the -fold difference in CUGbp2 mRNA in cMSCs lentivirally transfected with control shRNA or CUGbp2 shRNAs compared with vector control. E, reducing immunoblot of cMSCs transfected with vector control, control shRNA, or CUGbp2 shRNA showing specific knockdown of CUGbp2 protein. F, graph of the -fold difference for Ptgs2 mRNA in cMSCs transfected with control shRNA and CUGbp2 shRNA versus vector control. Shown is a reducing immunoblot of cMSCs treated with 10% serum, 0% serum, or 0% serum plus Fgf9 (250 ng/ml) (G) and quantification of the ratio of CUGbp2/actin in these cells (H). Base line (1.00) was the ratio of cMSCs grown in 10% serum. Immunoblots and quantifications are representative of three independent experiments. A, D, and F, the asterisks show comparison of data with -fold difference in cells grown in 10% serum. Statistical analysis was performed by Student's t test: *, p < 0.05; **, p < 0.01.
FIGURE 8.
FIGURE 8.
Model of Fgf9 regulation of Ptgs2 expression in cMSCs. Colonic MSCs express CD29, CD34, CD44, CD54, CD90, CD105, CD106, Sca-1, and Ptgs2. When Fgf9 is present, it signals through Fgfr1c and/or Fgfr2c on the cell surface. Transduction of this signal via ERK phosphorylation and activation results in an increase in CUGbp2 protein. This protein in turn binds to Ptgs2 mRNA and stabilizes the message. In the absence of Fgf9, ERK phosphorylation is decreased, resulting in decreased CUGbp2 protein quantity and loss of Ptgs2 mRNA stabilization.

Similar articles

Cited by

References

    1. Savage D. C. (1977) Annu. Rev. Microbiol. 31, 107–133 - PubMed
    1. Eckburg P. B., Bik E. M., Bernstein C. N., Purdom E., Dethlefsen L., Sargent M., Gill S. R., Nelson K. E., Relman D. A. (2005) Science 308, 1635–1638 - PMC - PubMed
    1. Ley R. E., Bäckhed F., Turnbaugh P., Lozupone C. A., Knight R. D., Gordon J. I. (2005) Proc. Natl. Acad. Sci. U.S.A. 102, 11070–11075 - PMC - PubMed
    1. Cliffe L. J., Humphreys N. E., Lane T. E., Potten C. S., Booth C., Grencis R. K. (2005) Science 308, 1463–1465 - PubMed
    1. Seno H., Miyoshi H., Brown S. L., Geske M. J., Colonna M., Stappenbeck T. S. (2009) Proc. Natl. Acad. Sci. U.S.A. 106, 256–261 - PMC - PubMed

Publication types

MeSH terms