. 2010 Feb 19;285(8):5522-31.
doi: 10.1074/jbc.M109.062836. Epub 2009 Dec 14.

Myosin light chain kinase is necessary for tonic airway smooth muscle contraction

Affiliations

Myosin light chain kinase is necessary for tonic airway smooth muscle contraction

Wen-Cheng Zhang et al. J Biol Chem. .

Abstract

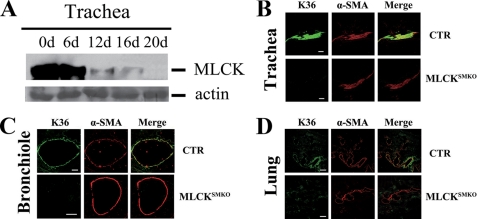
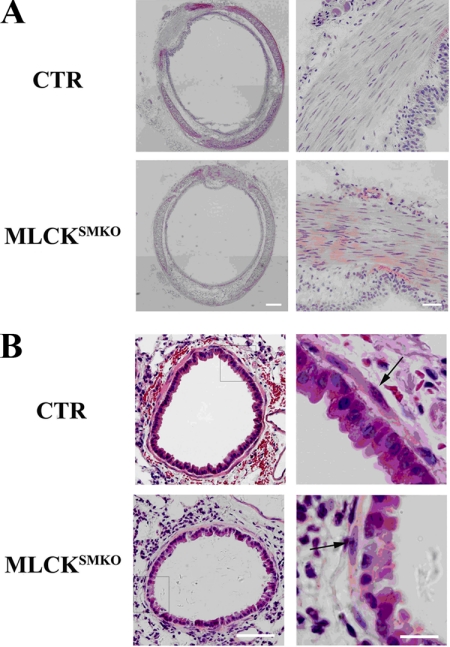
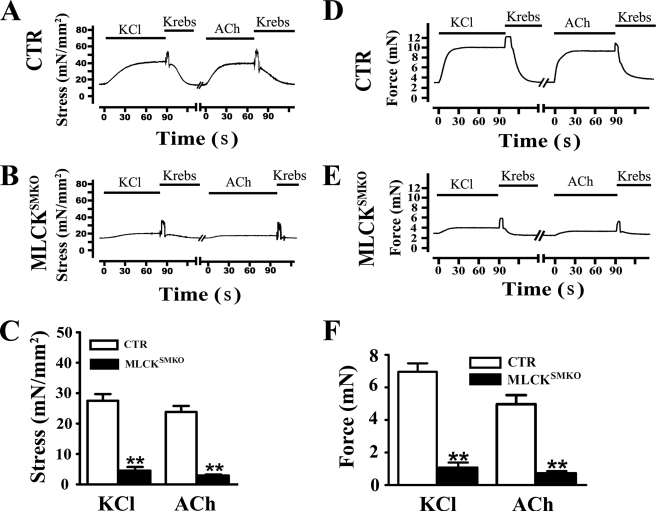
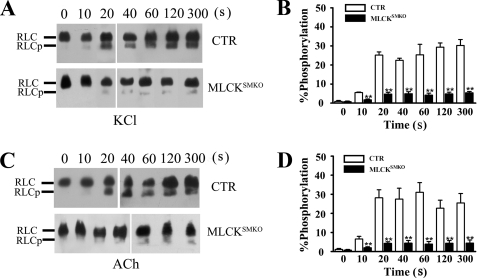
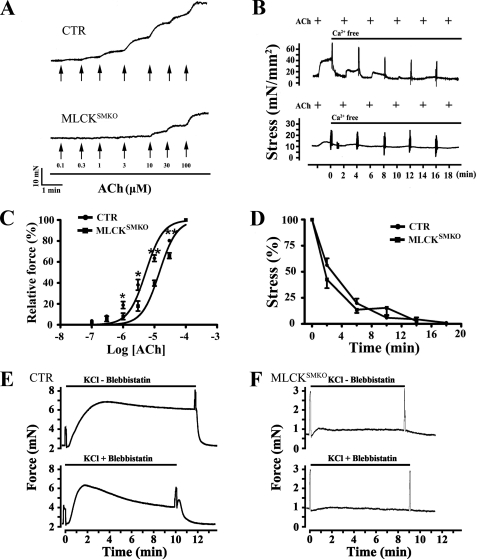
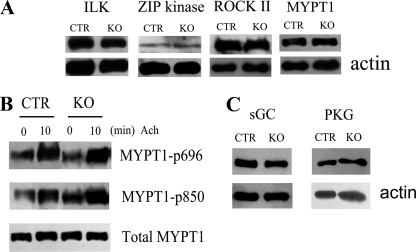
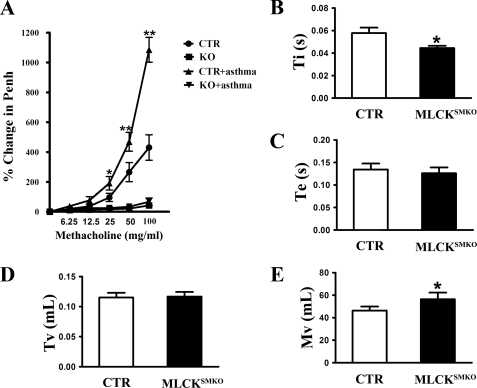
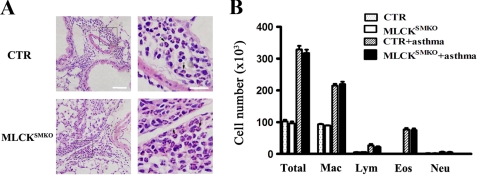
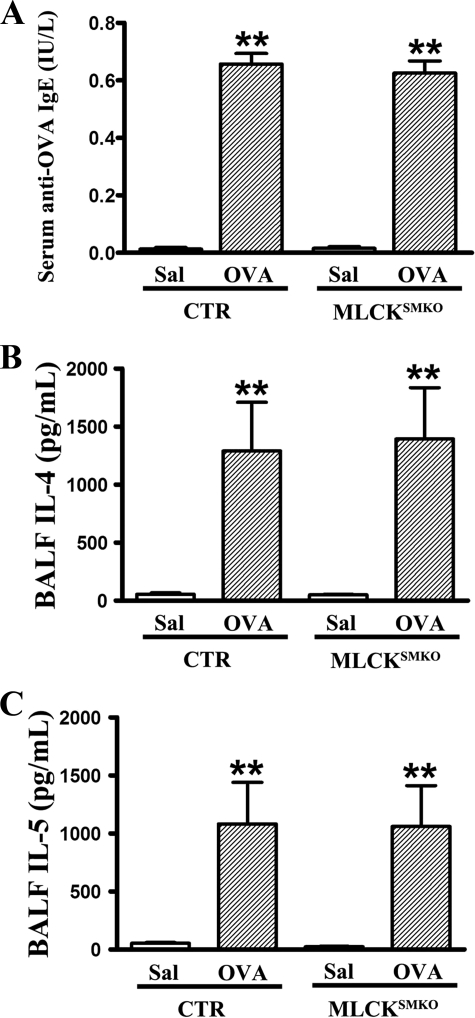
Different interacting signaling modules involving Ca(2+)/calmodulin-dependent myosin light chain kinase, Ca(2+)-independent regulatory light chain phosphorylation, myosin phosphatase inhibition, and actin filament-based proteins are proposed as specific cellular mechanisms involved in the regulation of smooth muscle contraction. However, the relative importance of specific modules is not well defined. By using tamoxifen-activated and smooth muscle-specific knock-out of myosin light chain kinase in mice, we analyzed its role in tonic airway smooth muscle contraction. Knock-out of the kinase in both tracheal and bronchial smooth muscle significantly reduced contraction and myosin phosphorylation responses to K(+)-depolarization and acetylcholine. Kinase-deficient mice lacked bronchial constrictions in normal and asthmatic airways, whereas the asthmatic inflammation response was not affected. These results indicate that myosin light chain kinase acts as a central participant in the contractile signaling module of tonic smooth muscle. Importantly, contractile airway smooth muscles are necessary for physiological and asthmatic airway resistance.


Figures

FIGURE 1.
FIGURE 1.
Targeted disruption of the Mlck gene in airway smooth muscle. A, Western blots of MLCK in tracheae from tamoxifen-treated mice collected at the indicated days (d) after treatment. Total actin stained with Coomassie Brilliant Blue G-250 was used as protein loading control. Immunofluorescence analysis of MLCK expression in tracheal (B) and lung (C and D) smooth muscle from control (CTR) and MLCKSMKO mice. At the 16th day after tamoxifen injection, the trachea and lung of MLCK-deficient mice and control were embedded in OCT and sectioned. After acetone fixation, frozen sections were stained with K36 antibody and α-smooth muscle actin antibody. Scale bars in panels B-D are 80, 100, and 200 μm, respectively.
FIGURE 2.
FIGURE 2.
Histological analysis of MLCK-deficient airway smooth muscle. Fresh tracheal and lung tissues from control (CTR) and MLCKSMKO knock-out mice were fixed with 4% formalin and dehydrated in a graded series of ethanol solutions followed by standard paraffin section and HE staining. Whole image of tracheal histology (left part of panel A) was made by merging images from different fields (marker measures 160 μm). Magnification for tracheal smooth muscle layer is shown in the right part of panel A (scale bar = 40 μm). Panel B represents histology of bronchiole in lung tissues (scale bar = 50 μm) and the magnification for the inset frame is shown in right part of panel B (scale bar = 15 μm). The arrows indicate smooth muscle cells.
FIGURE 3.
FIGURE 3.
Reduced contractions of tracheal and bronchial smooth muscle from MLCKSMKO mice. Representative recordings of tracheal ring contraction from control (CTR) (A) and MLCKSMKO (B) mice treated with 60 mm KCl or 10 μm ACh. Bars show duration of stimulation. Quantification of contraction responses to KCl and ACh is summarized (C). Columns represent mean ± S.E., n = 4–10; **, p < 0.01. Representative recordings of bronchial ring contraction from CTR (D) and MLCKSMKO (E) mice treated with 60 mm KCl or 10 μm ACh are shown. Quantification of bronchial contraction responses to KCl and ACh are shown (F). Columns represent mean ± S.E., n = 4–6; **, p < 0.01. Error bars indicate S.E.
FIGURE 4.
FIGURE 4.
Inhibition of RLC phosphorylation in tracheal smooth muscle from MLCKSMKO mice. RLC phosphorylation (RLCp) was measured in quick-frozen tracheal rings from control and MLCKSMKO mice treated with 60 mm KCl (A and B) or 10 μm ACh (C and D) as shown by representative Western blots of glycerol/urea PAGE gels and quantification. Columns represent mean. Error bars indicate S.E., n = 4–6; **, p < 0.01.
FIGURE 5.
FIGURE 5.
Ca2+ dependence of small contractions of MLCK-deficient trachea. Sensitivity to ACh of MLCK-deficient and control (CTR) trachea was assessed by isometric force measurements in response to cumulative increases in the concentration of ACh (A), and expressed as percent of maximal force with ACh (C). Arrows indicate the point at which the concentration of acetylcholine was increased; mean ± S.E. from 7 control (CTR) and 5 MLCKSMKO tracheal rings are shown; *, p < 0.05; **, p < 0.01. Panels B and D show the effects of Ca2+ depletion on tracheal smooth muscle contraction. Depletion of Ca2+ in CTR and MLCKSMKO tracheal smooth muscle by adding 1 mm EGTA in the bath solution inhibited the contractile responses to repeated exposure to 10 μm ACh (B). Quantification of contractile responses by CTR and MLCKSMKO muscles with Ca2+ depletion and normalized to pre-treatment values (D). Values are mean ± S.E. (n = 3–4). Panels E and F represent a typical inhibitory effect of blebbistatin on tracheal smooth muscle contraction. With or without addition of 30 μm blebbistatin to the incubation buffer, the isometric force of control (E) and MLCK-deficient (F) trachea developed with 80 mm KCl was measured. Each measurement was repeated in three to five independent animals.
FIGURE 6.
FIGURE 6.
Expression of contractile and related regulatory proteins in tracheae from MLCKSMKO mice. A, Western blots for integrin-linked protein kinase, ZIP kinase, ROCK II, and MYPT-1 expression in tracheal tissues from control (CTR) and MLCKSMKO mice. The samples were resolved by separate SDS-PAGE and β-actin was stained with anti-actin antibody as a loading control. B, MYPT1 phosphorylation at residues 696 and 850 in response to 10 μm ACh were measured by anti-MYPT1-P696 and anti-MYPT1-P850 antibodies. C, Western blots for PKG and sGC expression in CTR and mutant tracheal tissues. Blots shown are representative of at least three measurements. KO, knock-out.
FIGURE 7.
FIGURE 7.
Decreased airway respiratory resistance and altered breathing pattern in MLCK-deficient mice. A, MLCKSMKO and control (CTR) mice were immunized and challenged by OVA. On the day after the final aerosol challenge, airway responsiveness was measured noninvasively using whole body plethysmography. Data are expressed as percent above baseline. At the same time, some respiratory parameters such as Ti (B), Te (C), Tv (D), and Mv (E) at baseline were analyzed to compare the differences between the MLCKSMKO and control mice. Ti, time of inspiration; Te, time of expiration; Tv, tidal volume; Mv, minute volume. Values are mean ± S.E. (n = 6). Error bars indicate S.E. *, p < 0.05; **, p < 0.01, as compared with same condition without asthma.
FIGURE 8.
FIGURE 8.
Histopathology and inflammatory cells of lungs from control (CTR) and MLCKSMKO mice sensitized to ovalbumin. Two days after the last challenge with ovalbumin, the mice were anesthetized and killed. The lung and the bronchoalveolar fluid from mice were collected. A, histological examination (hematoxylin and eosin (HE) staining) of lung tissue from CTR mice (upper panels) shows dense perivascular and peribronchiolar eosinophils as indicated by the arrows. Lower panels show the histology of the lung from MLCKSMKO mice. The mutant lung shows similar histopathologic changes. Scale bar in the left panels is 60 μm; scale bar in the right panels is 20 μm. B, total number of macrophages, eosinophils, lymphocytes, and neutrophils in the bronchoalveolar fluid were determined by counting HE-stained cells. Dotted bars, CTR/saline; white bars, MLCKSMKO/saline; hatched bars, CTR/ovalbumin; black bars, MLCKSMKO/ovalbumin. Eos, eosinophils; Lym, lymphocytes; Mac, macrophages; Neu, neutrophils. Values are mean (columns) ± S.E. (error bars) (n = 6).
FIGURE 9.
FIGURE 9.
Immunological responses of ovalbumin-sensitized control (CTR) and MLCKSMKO mice. After the last challenge with ovalbumin, bronchoalveolar fluids of mice were collected. Ovalbumin (OVA)-specific IgE in serum (A) and cytokines IL-4 (B) and IL-5 (C) in bronchoalveolar fluid were measured by enzyme-linked immunosorbent assay according to the manufacturer's instructions. Values are mean (columns) ± S.E. (error bars) (n = 6). **, p < 0.01.

Similar articles

Cited by

References

    1. Golenhofen K., Mandrek K. (1991) Dig. Dis. 9, 341–346 - PubMed
    1. Somlyo A. V., Somlyo A. P. (1968) J. Pharmacol. Exp. Ther. 159, 129–145 - PubMed
    1. Ito M., Nakano T., Erdodi F., Hartshorne D. J. (2004) Mol. Cell. Biochem. 259, 197–209 - PubMed
    1. Kamm K. E., Stull J. T. (2001) J. Biol. Chem. 276, 4527–4530 - PubMed
    1. Murthy K. S. (2006) Annu. Rev. Physiol. 68, 345–374 - PubMed

Publication types

MeSH terms