

Uncoupling of inflammation and insulin resistance by NF-kappaB in transgenic mice through elevated energy expenditure
- PMID: 20018865
- PMCID: PMC2836069
- DOI: 10.1074/jbc.M109.068007
Uncoupling of inflammation and insulin resistance by NF-kappaB in transgenic mice through elevated energy expenditure
Erratum in
- J Biol Chem. 2012 Jan 2;287(1):803
Abstract
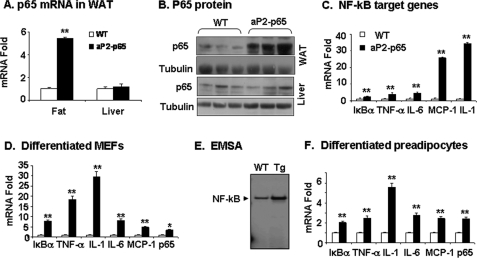
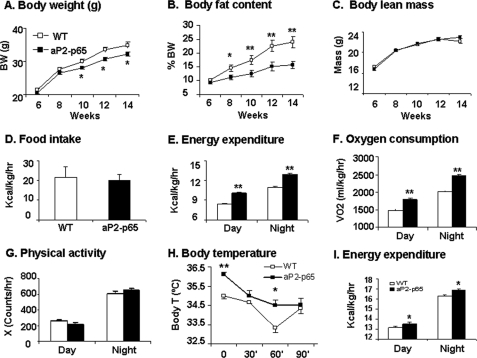
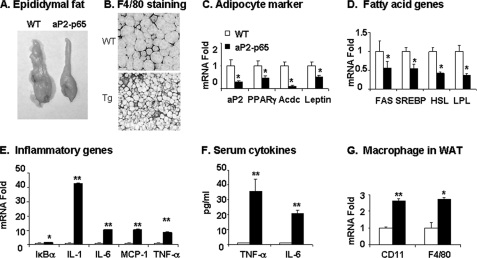
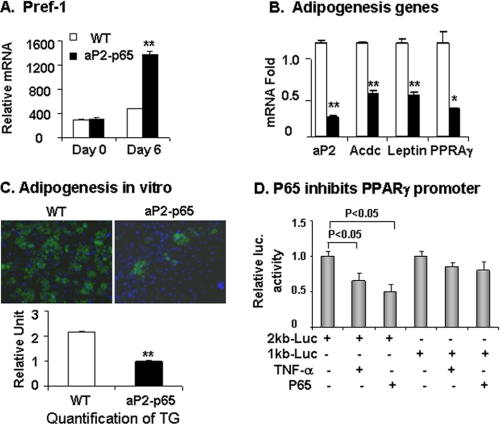
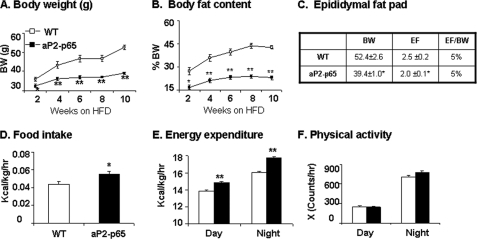
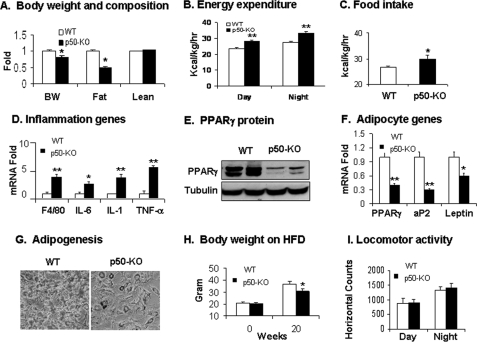
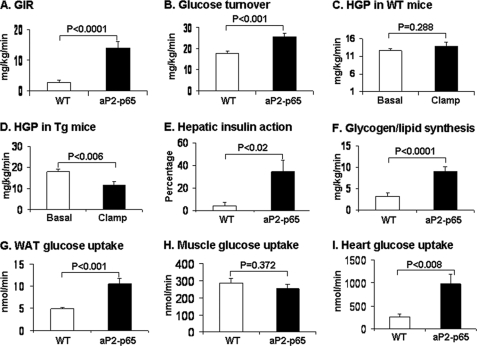
To study the metabolic activity of NF-kappaB, we investigated phenotypes of two different mouse models with elevated NF-kappaB activities. The transcriptional activity of NF-kappaB is enhanced either by overexpression of NF-kappaB p65 (RelA) in aP2-p65 mice or inactivation of NF-kappaB p50 (NF-kappaB1) through gene knock-out. In these models, energy expenditure was elevated in day and night time without a change in locomotion. The mice were resistant to adulthood obesity and diet-induced obesity without reduction in food intake. The adipose tissue growth and adipogenesis were inhibited by the elevated NF-kappaB activity. Peroxisome proliferator-activator receptor gamma expression was reduced by NF-kappaB at the transcriptional level. The two models exhibited elevated inflammatory cytokines (tumor necrosis factor-alpha and interleukin-6) in adipose tissue and serum. However, insulin sensitivity was not reduced by the inflammation in the mice on a chow diet. On a high fat diet, the mice were protected from insulin resistance. The glucose infusion rate was increased more than 30% in the hyperinsulinemic-euglycemic clamp test. Our data suggest that the transcription factor NF-kappaB promotes energy expenditure and inhibits adipose tissue growth. The two effects lead to prevention of adulthood obesity and dietary obesity. The energy expenditure may lead to disassociation of inflammation with insulin resistance. The study indicates that inflammation may prevent insulin resistance by eliminating lipid accumulation.
Figures
Similar articles
-
Inactivation of NF-κB p65 (RelA) in Liver Improves Insulin Sensitivity and Inhibits cAMP/PKA Pathway.Diabetes. 2015 Oct;64(10):3355-62. doi: 10.2337/db15-0242. Epub 2015 Jun 2. Diabetes. 2015. PMID: 26038580 Free PMC article.
-
Deficiency in AIM2 induces inflammation and adipogenesis in white adipose tissue leading to obesity and insulin resistance.Diabetologia. 2019 Dec;62(12):2325-2339. doi: 10.1007/s00125-019-04983-x. Epub 2019 Sep 11. Diabetologia. 2019. PMID: 31511929 Free PMC article.
-
Intermedin/adrenomedullin 2 polypeptide promotes adipose tissue browning and reduces high-fat diet-induced obesity and insulin resistance in mice.Int J Obes (Lond). 2016 May;40(5):852-60. doi: 10.1038/ijo.2016.2. Epub 2016 Jan 20. Int J Obes (Lond). 2016. PMID: 26786353
-
The role of Klotho in energy metabolism.Nat Rev Endocrinol. 2012 Oct;8(10):579-87. doi: 10.1038/nrendo.2012.75. Epub 2012 May 29. Nat Rev Endocrinol. 2012. PMID: 22641000 Free PMC article. Review.
-
The inflammation highway: metabolism accelerates inflammatory traffic in obesity.Immunol Rev. 2012 Sep;249(1):218-38. doi: 10.1111/j.1600-065X.2012.01151.x. Immunol Rev. 2012. PMID: 22889225 Free PMC article. Review.
Cited by
-
Inactivation of NF-κB p65 (RelA) in Liver Improves Insulin Sensitivity and Inhibits cAMP/PKA Pathway.Diabetes. 2015 Oct;64(10):3355-62. doi: 10.2337/db15-0242. Epub 2015 Jun 2. Diabetes. 2015. PMID: 26038580 Free PMC article.
-
Hyperglycemia-associated alterations in cellular signaling and dysregulated mitochondrial bioenergetics in human metabolic disorders.Eur J Nutr. 2016 Dec;55(8):2339-2345. doi: 10.1007/s00394-016-1212-2. Epub 2016 Apr 15. Eur J Nutr. 2016. PMID: 27084094 Free PMC article. Review.
-
On the Immunometabolic Role of NF-κB in Adipocytes.Immunometabolism. 2022;4(1):e220003. doi: 10.20900/immunometab20220003. Epub 2022 Jan 29. Immunometabolism. 2022. PMID: 35251704 Free PMC article.
-
The Combined Partial Knockdown of CBS and MPST Genes Induces Inflammation, Impairs Adipocyte Function-Related Gene Expression and Disrupts Protein Persulfidation in Human Adipocytes.Antioxidants (Basel). 2022 May 31;11(6):1095. doi: 10.3390/antiox11061095. Antioxidants (Basel). 2022. PMID: 35739994 Free PMC article.
-
NF- κ B/HDAC1/SREBP1c pathway mediates the inflammation signal in progression of hepatic steatosis.Acta Pharm Sin B. 2020 May;10(5):825-836. doi: 10.1016/j.apsb.2020.02.005. Epub 2020 Feb 21. Acta Pharm Sin B. 2020. PMID: 32528830 Free PMC article.
References
-
- Hayden M. S., Ghosh S. (2008) Cell 132, 344–362 - PubMed
-
- Yuan M., Konstantopoulos N., Lee J., Hansen L., Li Z. W., Karin M., Shoelson S. E. (2001) Science 293, 1673–1677 - PubMed
-
- Arkan M. C., Hevener A. L., Greten F. R., Maeda S., Li Z. W., Long J. M., Wynshaw-Boris A., Poli G., Olefsky J., Karin M. (2005) Nat. Med. 11, 191–198 - PubMed
Publication types
MeSH terms
Substances
Grants and funding
LinkOut - more resources
Full Text Sources
Molecular Biology Databases
Research Materials
