. 2010 Feb 19;285(8):5674-82.
doi: 10.1074/jbc.M109.066456. Epub 2009 Dec 17.

Distinct sarcomeric substrates are responsible for protein kinase D-mediated regulation of cardiac myofilament Ca2+ sensitivity and cross-bridge cycling

Affiliations

Distinct sarcomeric substrates are responsible for protein kinase D-mediated regulation of cardiac myofilament Ca2+ sensitivity and cross-bridge cycling

Sonya C Bardswell et al. J Biol Chem. .

Abstract

Protein kinase D (PKD), a serine/threonine kinase with emerging cardiovascular functions, phosphorylates cardiac troponin I (cTnI) at Ser(22)/Ser(23), reduces myofilament Ca(2+) sensitivity, and accelerates cross-bridge cycle kinetics. Whether PKD regulates cardiac myofilament function entirely through cTnI phosphorylation at Ser(22)/Ser(23) remains to be established. To determine the role of cTnI phosphorylation at Ser(22)/Ser(23) in PKD-mediated regulation of cardiac myofilament function, we used transgenic mice that express cTnI in which Ser(22)/Ser(23) are substituted by nonphosphorylatable Ala (cTnI-Ala(2)). In skinned myocardium from wild-type (WT) mice, PKD increased cTnI phosphorylation at Ser(22)/Ser(23) and decreased the Ca(2+) sensitivity of force. In contrast, PKD had no effect on the Ca(2+) sensitivity of force in myocardium from cTnI-Ala(2) mice, in which Ser(22)/Ser(23) were unavailable for phosphorylation. Surprisingly, PKD accelerated cross-bridge cycle kinetics similarly in myocardium from WT and cTnI-Ala(2) mice. Because cardiac myosin-binding protein C (cMyBP-C) phosphorylation underlies cAMP-dependent protein kinase (PKA)-mediated acceleration of cross-bridge cycle kinetics, we explored whether PKD phosphorylates cMyBP-C at its PKA sites, using recombinant C1C2 fragments with or without site-specific Ser/Ala substitutions. Kinase assays confirmed that PKA phosphorylates Ser(273), Ser(282), and Ser(302), and revealed that PKD phosphorylates only Ser(302). Furthermore, PKD phosphorylated Ser(302) selectively and to a similar extent in native cMyBP-C of skinned myocardium from WT and cTnI-Ala(2) mice, and this phosphorylation occurred throughout the C-zones of sarcomeric A-bands. In conclusion, PKD reduces myofilament Ca(2+) sensitivity through cTnI phosphorylation at Ser(22)/Ser(23) but accelerates cross-bridge cycle kinetics by a distinct mechanism. PKD phosphorylates cMyBP-C at Ser(302), which may mediate the latter effect.


Figures
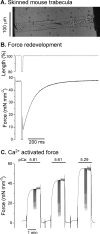
FIGURE 1.
FIGURE 1.
Ca2+ activated force and force redevelopment in mouse skinned trabeculae. A, a skinned trabecula, attached at either end to a force transducer and a high speed length controller. B, representative recording of force redevelopment after a release-restretch protocol at pCa 5.61. C, representative recording of Ca2+-activated force in bath solutions at pCa 5.81, 5.61, and 5.29.
FIGURE 2.
FIGURE 2.
Effects of PKD and PKA on cTnI phosphorylation at Ser22/Ser23 in skinned ventricular myocytes from WT (A) and cTnI-Ala2 (B) mice. The representative immunoblots (IB) show PKD- or PKA-mediated cTnI phosphorylation as detected by a phospho-specific Ser(P)22/23 cTnI antibody, with protein loading illustrated by Coomassie staining of the membranes. The bar charts show quantitative data from such experiments using multiple skinned myocyte preparations (four hearts/group). cTnI phosphorylation is expressed relative to a common positive control sample included in each experiment. *, p < 0.05 versus no-kinase control (con).
FIGURE 3.
FIGURE 3.
Effects of PKD and PKA on the Ca2+ sensitivity of force development in skinned ventricular trabeculae from WT (A) and cTnI-Ala2 (B) mice. The mean force-pCa curves show data obtained before (pre, open circles) and after (post, filled circles) incubation of trabeculae with PKD or PKA, as indicated. Force values were normalized to the maximum force, measured at pCa 4.5. The bar charts show mean pCa50 values obtained before (pre, open bars) and after (post, filled bars) incubation of trabeculae with PKD or PKA, as indicated. *, p < 0.05 versus pre-kinase (n = 7/group).
FIGURE 4.
FIGURE 4.
Effects of PKD and PKA on the rate of force redevelopment (ktr) in skinned ventricular trabeculae from WT (A) and cTnI-Ala2 (B) mice. The force-ktr relationships show data obtained before (pre, open circles) and after (post, filled circles) incubation of trabeculae with PKD or PKA, as indicated. Force values were normalized to the maximum force, and the ktr values were normalized to the maximum ktr, both measured at pCa 4.5. The bar charts show mean relative ktr at 50% maximum force obtained before (pre, open bars) and after (post, filled bars) incubation of trabeculae with PKD or PKA, as indicated. *, p < 0.05 versus pre-kinase (n = 7/group).
FIGURE 5.
FIGURE 5.
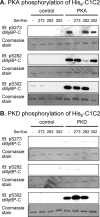
Phosphorylation by PKA (A) or PKD (B) of recombinant His6-tagged C1C2 fragments of human cMyBP-C, in WT form, or with a Ser/Ala substitution at Ser273, Ser282, or Ser302. Phosphorylation was detected by immunoblot (IB) analysis using phospho-specific Ser(P)273, Ser(P)282, or Ser(P)302 cMyBP-C antibodies with protein loading illustrated by Coomassie staining of the membranes.
FIGURE 6.
FIGURE 6.
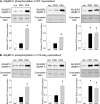
Effects of PKD and PKA on cMyBP-C phosphorylation at Ser273, Ser282, and Ser302 in skinned ventricular myocytes from WT (A) and cTnI-Ala2 (B) mice. The representative immunoblots (IB) show PKD- or PKA-mediated cMyBP-C phosphorylation as detected by phospho-specific Ser(P)273, Ser(P)282, and Ser(P)302 cMyBP-C antibodies, with protein loading illustrated by Coomassie staining of the membranes. The bar charts show quantitative data from such experiments using multiple skinned myocyte preparations (4 hearts/group). cMyBP-C phosphorylation is expressed relative to a common positive control sample included in each experiment. *, p < 0.05 versus no-kinase control (con).
FIGURE 7.
FIGURE 7.
Confocal microscope images showing the localization of total cMyBP-C (A) and cMyBP-C phosphorylated at Ser302 (B) in skinned myocytes from WT and cTnI-Ala2 (Ala2) mice following incubation with no kinase (CON), PKD, or PKA. The samples were immunolabeled additionally with an α-actinin antibody to demarcate the Z-discs, and the nuclei were stained with 4′,6′-diamino-2-phenylindole. The images were obtained from perinuclear regions of each sample. In the merged images, red indicates α-actinin labeling, green indicates cMyBP-C (total and Ser(P)302) labeling, and the nuclei are stained blue. Scale bar, 10 μm.

Similar articles

Cited by

References

    1. Avkiran M., Rowland A. J., Cuello F., Haworth R. S. (2008) Circ. Res. 102, 157–163 - PubMed
    1. Vega R. B., Harrison B. C., Meadows E., Roberts C. R., Papst P. J., Olson E. N., McKinsey T. A. (2004) Mol. Cell. Biol. 24, 8374–8385 - PMC - PubMed
    1. Harrison B. C., Kim M. S., van Rooij E., Plato C. F., Papst P. J., Vega R. B., McAnally J. A., Richardson J. A., Bassel-Duby R., Olson E. N., McKinsey T. A. (2006) Mol. Cell. Biol. 26, 3875–3888 - PMC - PubMed
    1. Fielitz J., Kim M. S., Shelton J. M., Qi X., Hill J. A., Richardson J. A., Bassel-Duby R., Olson E. N. (2008) Proc. Natl. Acad. Sci. U.S.A. 105, 3059–3063 - PMC - PubMed
    1. Haworth R. S., Cuello F., Herron T. J., Franzen G., Kentish J. C., Gautel M., Avkiran M. (2004) Circ. Res. 95, 1091–1099 - PubMed

Publication types

MeSH terms