. 2010 Feb 26;285(9):6750-60.
doi: 10.1074/jbc.M109.067082. Epub 2009 Dec 16.

Sulfation of colonic mucins by N-acetylglucosamine 6-O-sulfotransferase-2 and its protective function in experimental colitis in mice

Affiliations

Sulfation of colonic mucins by N-acetylglucosamine 6-O-sulfotransferase-2 and its protective function in experimental colitis in mice

Yuki Tobisawa et al. J Biol Chem. .

Abstract

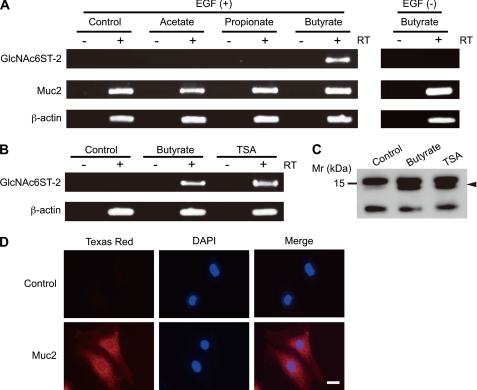
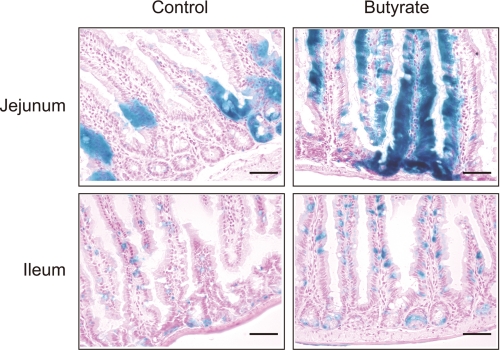
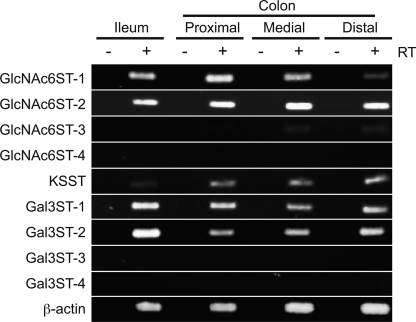
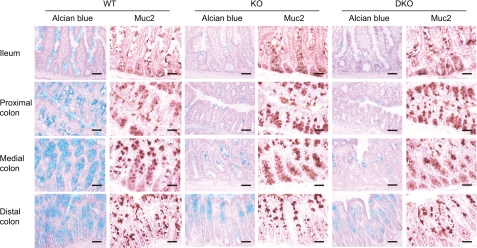
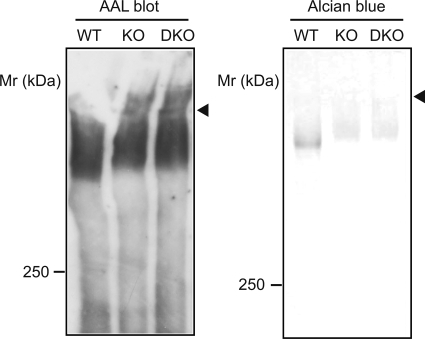
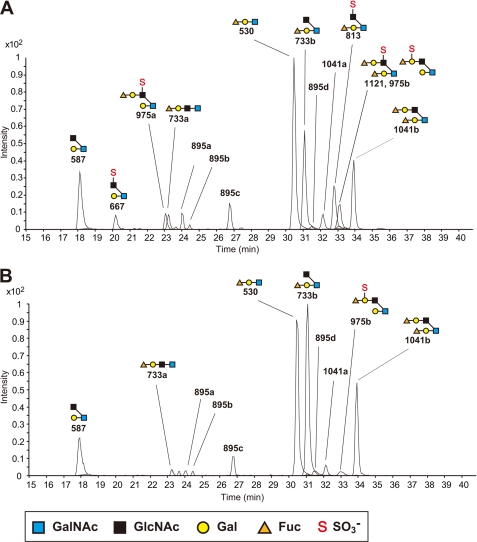
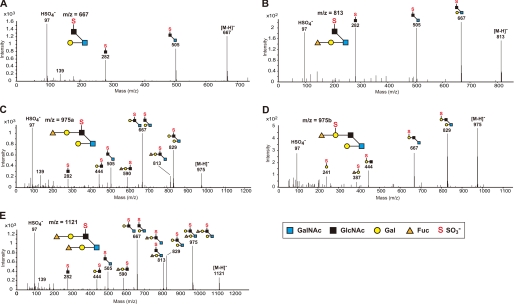
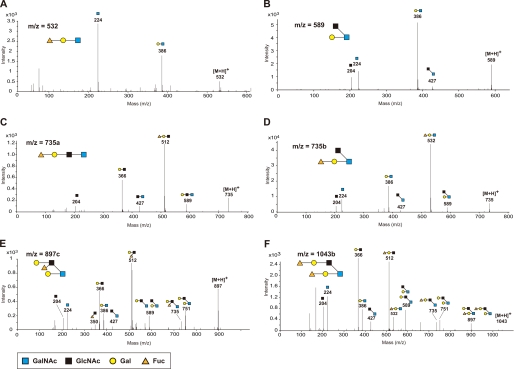
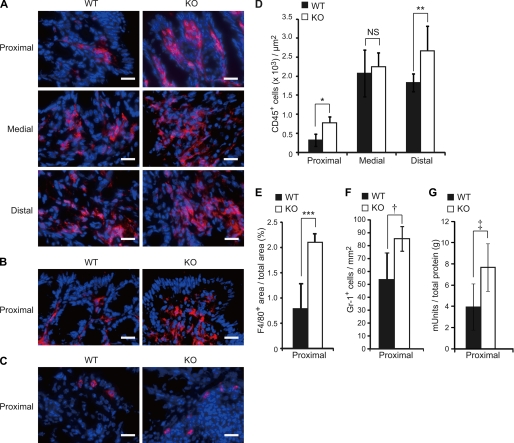
N-Acetylglucosamine 6-O-sulfotransferase-2 (GlcNAc6ST-2) catalyzes the sulfation of mucin-like glycoproteins, which function as ligands for a lymphocyte homing receptor, L-selectin, in the lymph node high endothelial venules (HEVs). We previously showed that GlcNAc6ST-2 is expressed not only in lymph node HEVs but also in the colonic epithelial cells in mice. Here we investigated the regulatory mechanism and physiological significance of colonic expression of GlcNAc6ST-2 in mice. Treatment of a mouse colonic epithelial cell line with butyrate, a short-chain fatty acid produced by anaerobic bacteria, induced GlcNAc6ST-2 expression in the presence of epidermal growth factor. Administration of butyrate in the drinking water stimulated GlcNAc6ST-2 expression in the mouse intestine, indicating that butyrate could serve as a regulatory molecule for the GlcNAc6ST-2 expression in vivo. Immunohistochemical analysis indicated that the sulfation of colonic mucins was greatly diminished in GlcNAc6ST-2-deficient mice. Liquid chromatography coupled to electrospray ionization tandem mass spectrometry of the colonic-mucin O-glycans from wild-type and GlcNAc6ST-2-deficient mice showed that GlcNAc-6-O-sulfation was the predominant sulfate modification of these mucins, and it was exclusively mediated by GlcNAc6ST-2. After colitis induction by dextran sulfate sodium, significantly more leukocyte infiltration was observed in the colon of GlcNAc6ST-2-deficient mice than in that of wild-type mice, indicating that the sulfation of colonic mucins by GlcNAc6ST-2 has a protective function in experimental colitis. These findings indicate that GlcNAc6ST-2, whose expression is regulated by butyrate, is a major sulfotransferase in the biosynthesis of sulfomucins in the mouse colon, where they serve as a mucosal barrier against colonic inflammation.


Figures

FIGURE 1.
FIGURE 1.
Induction of GlcNAc6ST-2 mRNA by sodium butyrate. CAdC1 cells were treated with or without (Control) 4 mm sodium acetate, sodium propionate, or sodium butyrate in the presence or absence of 10 ng/ml EGF, and subjected to RT-PCR analysis using primer pairs for GlcNAc6ST-2, Muc2, and β-actin (A). CAdC1 cells were treated with or without (Control) 4 mm sodium butyrate or 0.5 μm TSA in the presence of 10 ng/ml EGF, and subjected to RT-PCR analysis for GlcNAc6ST-2 or β-actin (B), or Western blotting using an anti-acetylated-lysine antibody (C). For PCR, single-stranded cDNAs prepared in the presence (+RT) or absence (−RT) of reverse transcriptase were used as templates. Arrowhead in C indicates a 14-kDa band corresponding to the molecular size of histone H2A and H2B (27). CAdC1 cells were stained with normal rabbit IgG (Control) or rabbit anti-Muc2 pAb (Muc2) together with Texas Red-conjugated secondary antibody and DAPI, and analyzed under fluorescence microscope BZ-9000 (D). Bar, 20 μm. Data are representative of four independent experiments.
FIGURE 2.
FIGURE 2.
Induction of LacZ by sodium butyrate in the small intestine of GlcNAc6ST-2-Cre+/R26R mice. GlcNAc6ST-2-Cre+/R26R mice (12) were given drinking water with or without (Control) 5 mm sodium butyrate for 24 h. Frozen sections of the jejunum and ileum were subjected to LacZ staining as described previously (12). Bar, 50 μm. Data are representative of four independent experiments.
FIGURE 3.
FIGURE 3.
Expression of sulfotransferases in the mouse intestine. RT-PCR analysis for various sulfotransferases was performed using mRNAs from the ileum, proximal colon, medial colon, and distal colon of the C57BL/6 WT mouse. For PCR, single-stranded cDNAs prepared in the presence (+RT) or absence (−RT) of reverse transcriptase were used as templates. Data are representative of three independent experiments.
FIGURE 4.
FIGURE 4.
Expression of sulfated carbohydrates and Muc2 in the intestine of WT, KO, and DKO mice. Frozen sections from WT, KO, and DKO mice were stained with Alcian blue (pH 1.0), or anti-Muc2 pAb. Bar, 50 μm. Data are representative of three (WT and KO), or two (DKO) independent experiments.
FIGURE 5.
FIGURE 5.
Lectin blot and Alcian blue staining of colonic mucins. Muc2-enriched fractions from WT, KO, and DKO mice were separated by SDS-PAGE and subjected to lectin blotting using AAL, and to Alcian blue staining. Arrowheads indicate the boundary between the stacking and separating gel. Data are representative of three independent experiments.
FIGURE 6.
FIGURE 6.
LC-ESI-MS analysis of the oligosaccharides on colonic mucins. LC-ESI-MS total ion chromatogram of the oligosaccharides in the Muc2-enriched fraction from the colon of WT (A) and KO (B) mice. LC-ESI-MS was operated in the negative ion mode. The annotations correspond to the [M-H] ions listed in Table 1. Data are representative of five independent experiments.
FIGURE 7.
FIGURE 7.
LC-ESI-MS/MS analysis of the sulfated oligosaccharides on colonic mucins. ESI tandem mass spectra of the [M-H] ions obtained from m/z 667 (A), m/z 813 (B), m/z 975a (C), m/z 975b (D), and m/z 1121 (E). The collision energies applied were: for m/z 667, 50 eV; for m/z 813, 60 eV; for m/z 975a, 80eV; for m/z 975b, 70 eV; and for m/z 1121, 90 eV. LC-ESI-MS/MS was operated in the negative ion mode. Note the presence of m/z 97 (HSO4) in all the ESI tandem mass spectra. Data are representative of three independent experiments.
FIGURE 8.
FIGURE 8.
LC-ESI-MS/MS analysis of the neutral oligosaccharides on colonic mucins. ESI tandem mass spectra of [M+H]+ ions obtained from m/z 532 (A), m/z 589 (B), m/z 735a (C), m/z 735b (D), m/z 897c (E), and m/z 1043b (F), corresponding to the [M-H] ions obtained from m/z 530, m/z 587, m/z 733a, m/z 733b, m/z 895c, and m/z 1041b in Table 1, respectively. LC-ESI-MS/MS was operated in the positive ion mode, and the collision energies applied were: for m/z 532, and 589, 5 eV; for m/z 735a, and 735b, 10 eV; and for m/z 897c and 1043b, 15 eV. Data are representative of three independent experiments.
FIGURE 9.
FIGURE 9.
Accelerated leukocyte infiltration in KO mice after DSS treatment. WT and KO mice were given drinking water containing 5% DSS for 7 days. A, frozen sections of the proximal, medial, and distal colon were stained with AlexaFluor 647-labeled anti-CD45 mAb (red) and DAPI (blue), and analyzed by fluorescence microscopy (BZ-9000). Bar, 20 μm. B and C, frozen sections of the proximal colon were stained with AlexaFluor 647-labeled anti-F4/80 mAb (B) or anti-Gr-1 mAb (C) (red), and DAPI (blue). Bar, 20 μm. D, number of CD45+ leukocytes per 1 μm2 in the colon after DSS treatment. Each bar represents the mean ± S.D. of triplicate determinations. n = 3. *, p = 0.015; **, p = 0.054, and NS, not significant. E, percentage of the total area that was F4/80+ in the proximal colon. Each bar represents the mean ± S.D. of triplicate determinations. n = 3. ***, p = 0.006. F, number of Gr-1+ granulocutes per one mm2 in the proximal colon after DSS treatment. Each bar represents the mean ± S.D. of triplicate determinations. n = 3. †, p = 0.019. G, determination of peroxidase activity as an index of granulocyte infiltration into the proximal colon. Results are expressed as peroxidase milliunits per gram total protein. Each bar represents the mean ± S.D. of triplicate determinations. WT, n = 5; KO, n = 4. ‡, p = 0.020.

References

    1. Bishop J. R., Schuksz M., Esko J. D. (2007) Nature 446, 1030–1037 - PubMed
    1. Kreuger J., Spillmann D., Li J. P., Lindahl U. (2006) J. Cell Biol. 174, 323–327 - PMC - PubMed
    1. Honke K., Zhang Y., Cheng X., Kotani N., Taniguchi N. (2004) Glycoconj. J. 21, 59–62 - PubMed
    1. Kawashima H. (2006) Biol. Pharm. Bull. 29, 2343–2349 - PubMed
    1. Fukuda M., Hiraoka N., Akama T. O., Fukuda M. N. (2001) J. Biol. Chem. 276, 47747–47750 - PubMed

Publication types

LinkOut - more resources