. 2010 Feb 19;285(8):5896-906.
doi: 10.1074/jbc.M109.090233. Epub 2009 Dec 16.

Aquaporin-1 tunes pain perception by interaction with Na(v)1.8 Na+ channels in dorsal root ganglion neurons

Affiliations

Aquaporin-1 tunes pain perception by interaction with Na(v)1.8 Na+ channels in dorsal root ganglion neurons

Hua Zhang et al. J Biol Chem. .

Abstract

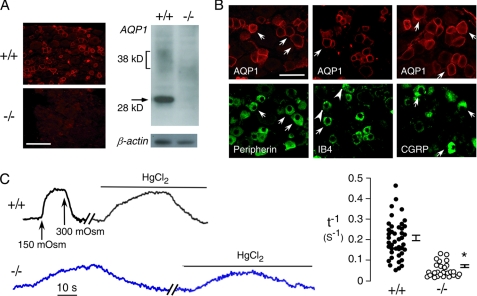
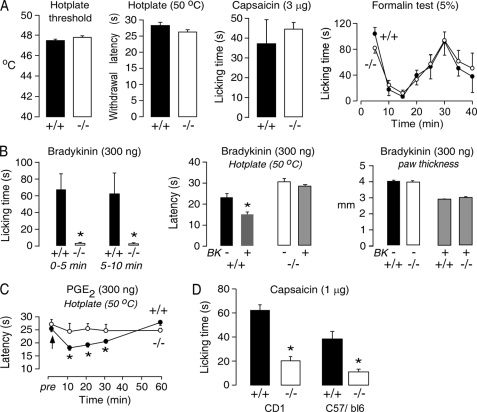
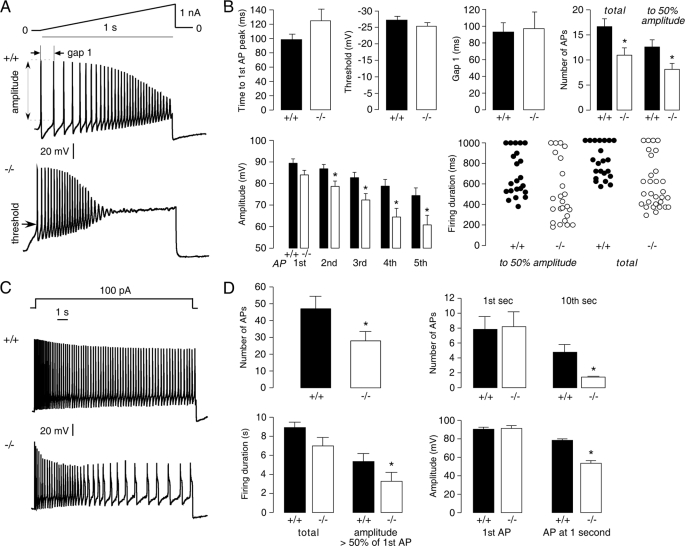
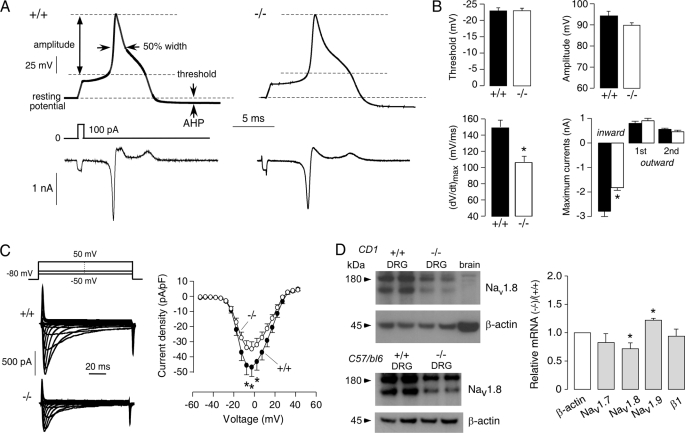
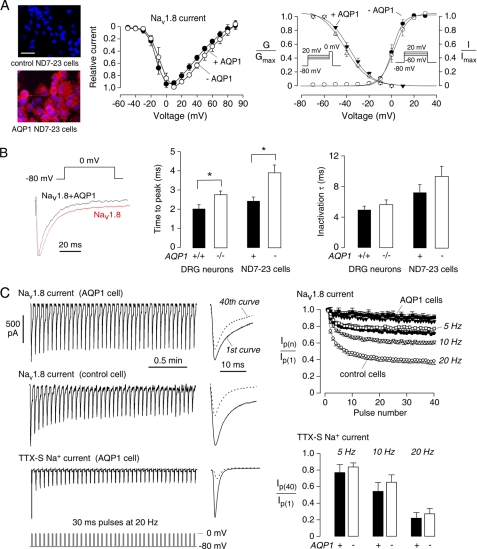
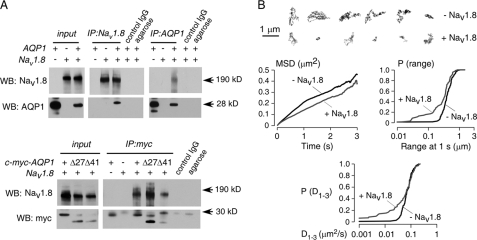
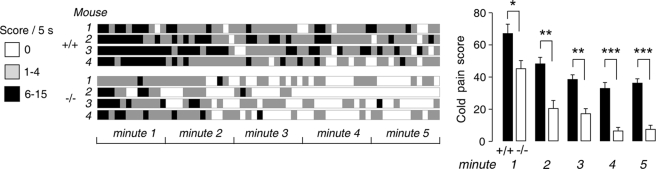
Aquaporin-1 (AQP1) water channels are expressed in the plasma membrane of dorsal root ganglion (DRG) neurons. We found reduced osmotic water permeability in freshly isolated DRG neurons from AQP1(-/-) versus AQP1(+/+) mice. Behavioral studies showed greatly reduced thermal inflammatory pain perception in AQP1(-/-) mice evoked by bradykinin, prostaglandin E(2), and capsaicin as well as reduced cold pain perception. Patch clamp of freshly isolated DRG neurons showed reduced action potential firing in response to current injections. Single action potentials after pulse current injections showed reduced maximum inward current, suggesting impaired Na(v)1.8 Na(+) function. Whole-cell Na(v)1.8 Na(+) currents in Na(v)1.8-expressing ND7-23 cells showed slowed frequency-dependent inactivation after AQP1 transfection. Immunoprecipitation studies showed AQP1- Na(v)1.8 Na(+) interaction, which was verified in live cells by single-particle tracking of quantum dot-labeled AQP1. Our results implicate the involvement of AQP1 in DRG neurons for the perception of inflammatory thermal pain and cold pain, whose molecular basis is accounted for, in part, by reduced Na(v)1.8-dependent membrane Na(+) current. AQP1 is, thus, a novel target for pain management.


Figures

FIGURE 1.
FIGURE 1.
AQP1 expression and water permeability in DRG neurons. A, shown is AQP1 immunofluorescence (left) and an immunoblot (right) of freshly isolated DRG neurons from AQP1+/+ and AQP1−/− mice. Bar, 100 μm. B, shown is immunostaining for AQP1 (red) and nociceptor markers peripherin (left), IB4 (center), and calcitonin gene-related peptide (right). Arrows indicate examples of colocalization, and arrowheads indicate examples without colocalization. Bar, 50 μm. C, osmotic water permeability of DRG neurons is shown. Left, time course of calcein fluorescence in response to exchange between isosmolar and hypo-osmolar (150 mosm) solutions is shown. Data are shown for AQP1+/+ and AQP1−/− DRG neurons under control conditions and after application of HgCl2 (100 μm). Right, a summary of deduced reciprocal half-times (t−1) for osmotic equilibration is shown. Filled circles show individual measurements (S.E., t test; *, p < 0.001).
FIGURE 2.
FIGURE 2.
Impaired peripheral pain nociception in AQP1−/− mice. A, shown are behavioral responses to thermal stimuli (hotplate threshold and withdrawal latency) (S.E., 27 AQP1+/+ mice, 20 AQP1−/− mice; t test; *, p = 0.15 and 0.6), intraplantar injection of 3 μg/paw capsaicin (S.E., 5 mice per genotype; t test; p = 0.22), and intraplantar injection of formalin (S.E., 6 mice per genotype, analysis of variance, p = 0.33). B, left, shown is licking time at 0–5 min and 5–10 min after intraplantar injection of 300 ng bradykinin (S.E., 10 mice per genotype; t test; *, p < 0.001). Middle, shown is hotplate latency at 10 min after bradykinin injection (S.E., 6 mice per genotype; t test; *, p = 0.001). Right, shown is paw thickness at 10 min after bradykinin injection (S.E., n = 10 mice per genotype, differences are not significant). C, shown is hotplate latency after intraplantar injection of 300 ng of PGE2 (S.E., 6 mice per genotype; t test; *, p = 0.008 at 10 min, p = 0.01 at 20 min, p = 0.03 at 30 min). D, shown is paw licking time 5 min after intraplantar injection of 1 μg/paw capsaicin (S.E., 7 mice per genotype in CD1 background; t test; *, p < 0.001, 8 mice per genotype in C57/b6 background; t test; *, p < 0.001).
FIGURE 3.
FIGURE 3.
Impaired firing of AQP1−/− DRG neurons after sustained stimulation. A, examples are shown of small DRG neuron responses to a 1-s linear current ramp (0–1 nA). B, shown is analysis of data as in A (S.E., 22 AQP1+/+ neurons and 24 AQP1−/− neurons). Differences were not significant by t test, except as indicated by the asterisks (p < 0.05). C, examples are shown of small DRG neuron responses to 10-s constant current injection (100 pA). D, shown is analysis of data as in C (S.E., 22 AQP1+/+ neurons and 21 AQP1−/− neurons). Differences were not significant by t test or rank sum test for firing duration, except as indicated by the asterisks (p < 0.05).
FIGURE 4.
FIGURE 4.
Impaired inward Na+ current in AQP1−/− DRG neurons. A, top, examples are shown of single APs from small DRG neurons elicited by injection of a 1-ms depolarizing current. Threshold, amplitude, 50% width, resting potential, and after-hyperpolarization (AHP) indices are indicated. Bottom, shown is ion current computed from the voltage waveform as −C.dV/dt, where C is the cell capacitance. B, analysis of data is as in A (S.E., 26 AQP1+/+ neurons and 28 AQP1−/− neurons). Differences not are significant by t test, except as indicated by the asterisks (p < 0.05). C, left, examples are shown of whole-cell TTX-R Na+ currents. Right, shown is the current-voltage relationship of TTX-R Na+ currents (normalized by cell capacitance) (S.E., 22 AQP1+/+ neurons and 17 AQP1−/− neurons, paired t test; *, p < 0.05). pF, picofarads. D, left, shown is a Nav1.8 immunoblot of DRG in AQP1+/+ and AQP1+/+ mice (CD1 and C57/b6 genetic backgrounds), with β-actin immunoblot for the same samples. Right, shown is relative mRNA expression of AQP1, Nav1.8, Nav1.7, Nav1.9, and sodium channel β1 subunit quantified by real-time PCR (S.E., 3 mice per genotype). *, p < 0.05.
FIGURE 5.
FIGURE 5.
AQP1-sensitive Nav1.8 current in transfected ND7-23 cells. A, left, AQP1 immunofluorescence (red) in non-transfected and AQP1 stably transfected ND7-23 cells is shown. Nuclei were counterstained blue with 4′,6-diamidino-2-phenylindole. Bar, 50 μm. Middle, shown is the current-voltage relationship of Nav1.8 currents in control and AQP1 stably expressing ND7-23 cells. Current was normalized to the current at 0 mV (analysis of variance, p = 0.52). Right, shown is voltage-dependent activation (G/Gmax) of Nav1.8 with fitted parameters: AQP1-expressing ND7-23 cells, V1/2 = −4 ± 1 mV, k = 5 ± 1 mV, n = 8; control ND7-23 cells, V1/2 = −3 ± 1 mV, k = 5 ± 1 mV, n = 8. Shown is steady-state inactivation (I/Imax) with fitted parameters: AQP1-expressing ND7-23 cells, V1/2 = −38 ± 2 mV, k = −10 ± 1 mV, n = 9; control ND7-23 cells, V1/2 = −41 ± 2 mV, k = −10 ± 1 mV, n = 8 (t test, p = 0.35 and 0.45). B, left, examples of Nav1.8 current evoked by 100-ms pulses from −80 to 0 mV from control and AQP1-expressing ND7-23 cells; middle, activation time of Nav1.8 at 0 mV was significantly lower in AQP1-expressing ND7-23 cells and AQP1+/+ DRG neurons (S.E., t test; *, p = 0.001 for the ND7-23 cell, 0.004 for DRG cells); right, inactivation time at 0 mV shows no differences (p = 0.26 for ND7-23 cells and 0.33 for DRG cells). C, left, examples are shown of Nav1.8 current evoked by 30-ms pulses from −80 to 0 mV at 20 Hz and example of TTX-S Na+ current in AQP1-expressing cell. Na+ currents elicited by the 1st and 40th pulses are shown at the right. Right, top, peak Nav1.8 currents from control and AQP1-expressing ND7-23 cells (normalized to peak current from the 1st pulse) are shown as a function of pulse number and pulse simulation frequencies of 5, 10, and 20 Hz (S.E., 6 control and 6 AQP1 cells). Right, bottom, shown is normalized peak TTX-S Na+ currents at the 40th pulse at 5, 10, and 20 Hz frequencies in control and AQP1-expressing cells (S.E., t test, 4 control and 4 AQP1 cells).
FIGURE 6.
FIGURE 6.
Evidence for physical interaction between Nav1.8 and AQP1. A, top, immunoprecipitations (IP) from ND7-23 cell expressing AQP1 and Nav1.8 are shown. Input shows AQP1 and Nav1.8 protein expression. Pulldown with anti-AQP1 antibody (against AQP1 C terminus) shows co-precipitated Nav1.8 protein (control IgG and agarose beads negative). Pulldown with anti-Nav1.8 antibody shows co-precipitated AQP1 protein (control IgG and agarose beads negative). WB, Western blot. Bottom, AQP1-Nav1.8 interaction does not involve the AQP1 C terminus. Pulldown done with anti-Myc antibody (against engineered extracellular c-myc epitope on AQP1) shows co-precipitated Nav1.8 protein with full-length AQP1.T120.myc and C-terminal AQP1 truncations. B, shown is single particle quantum dot tracking of AQP1 in the plasma membrane of ND7-23 cells. Top, shown is representative trajectories for AQP1 diffusion over 6 s in the absence (black) or presence (red) of co-expressed Nav1.8. Bar, 1 μm. Bottom, data summary is shown as a mean-squared displacement (MSD) plot and cumulative probability distributions of AQP1 diffusion coefficient, D1–3, and range at 1 s. Data are summarized for ∼200 trajectories on >15 cells.
FIGURE 7.
FIGURE 7.
Reduced cold pain perception in AQP1−/− mice. Real-time scoring of cold pain sensitivity in litter-matched AQP1+/+ and AQP1 −/− mice is shown. A, scores are shown in 5-s intervals over 5 min for 4 mice of each genotype. B, average scores are shown over 5 min (S.E., 8 AQP1+/+ mice and 7 AQP1−/− mice; t test; *, p = 0.03 for 1 min; **, p = 0.002 for 2 min; p = 0.001 for 3 min; ***, p < 0.001 for 4 and 5 min).

Similar articles

Cited by

References

    1. Papadopoulos M. C., Manley G. T., Krishna S., Verkman A. S. (2004) FASEB J. 18, 1291–1293 - PubMed
    1. Manley G. T., Fujimura M., Ma T., Noshita N., Filiz F., Bollen A. W., Chan P., Verkman A. S. (2000) Nat. Med. 6, 159–163 - PubMed
    1. Auguste K. I., Jin S., Uchida K., Yan D., Manley G. T., Papadopoulos M. C., Verkman A. S. (2007) FASEB J. 21, 108–116 - PubMed
    1. Saadoun S., Papadopoulos M. C., Watanabe H., Yan D., Manley G. T., Verkman A. S. (2005) J. Cell Sci. 118, 5691–5698 - PubMed
    1. Binder D. K., Yao X., Zador Z., Sick T. J., Verkman A. S., Manley G. T. (2006) Glia 53, 631–636 - PubMed

Publication types

MeSH terms